Fig. A.1.
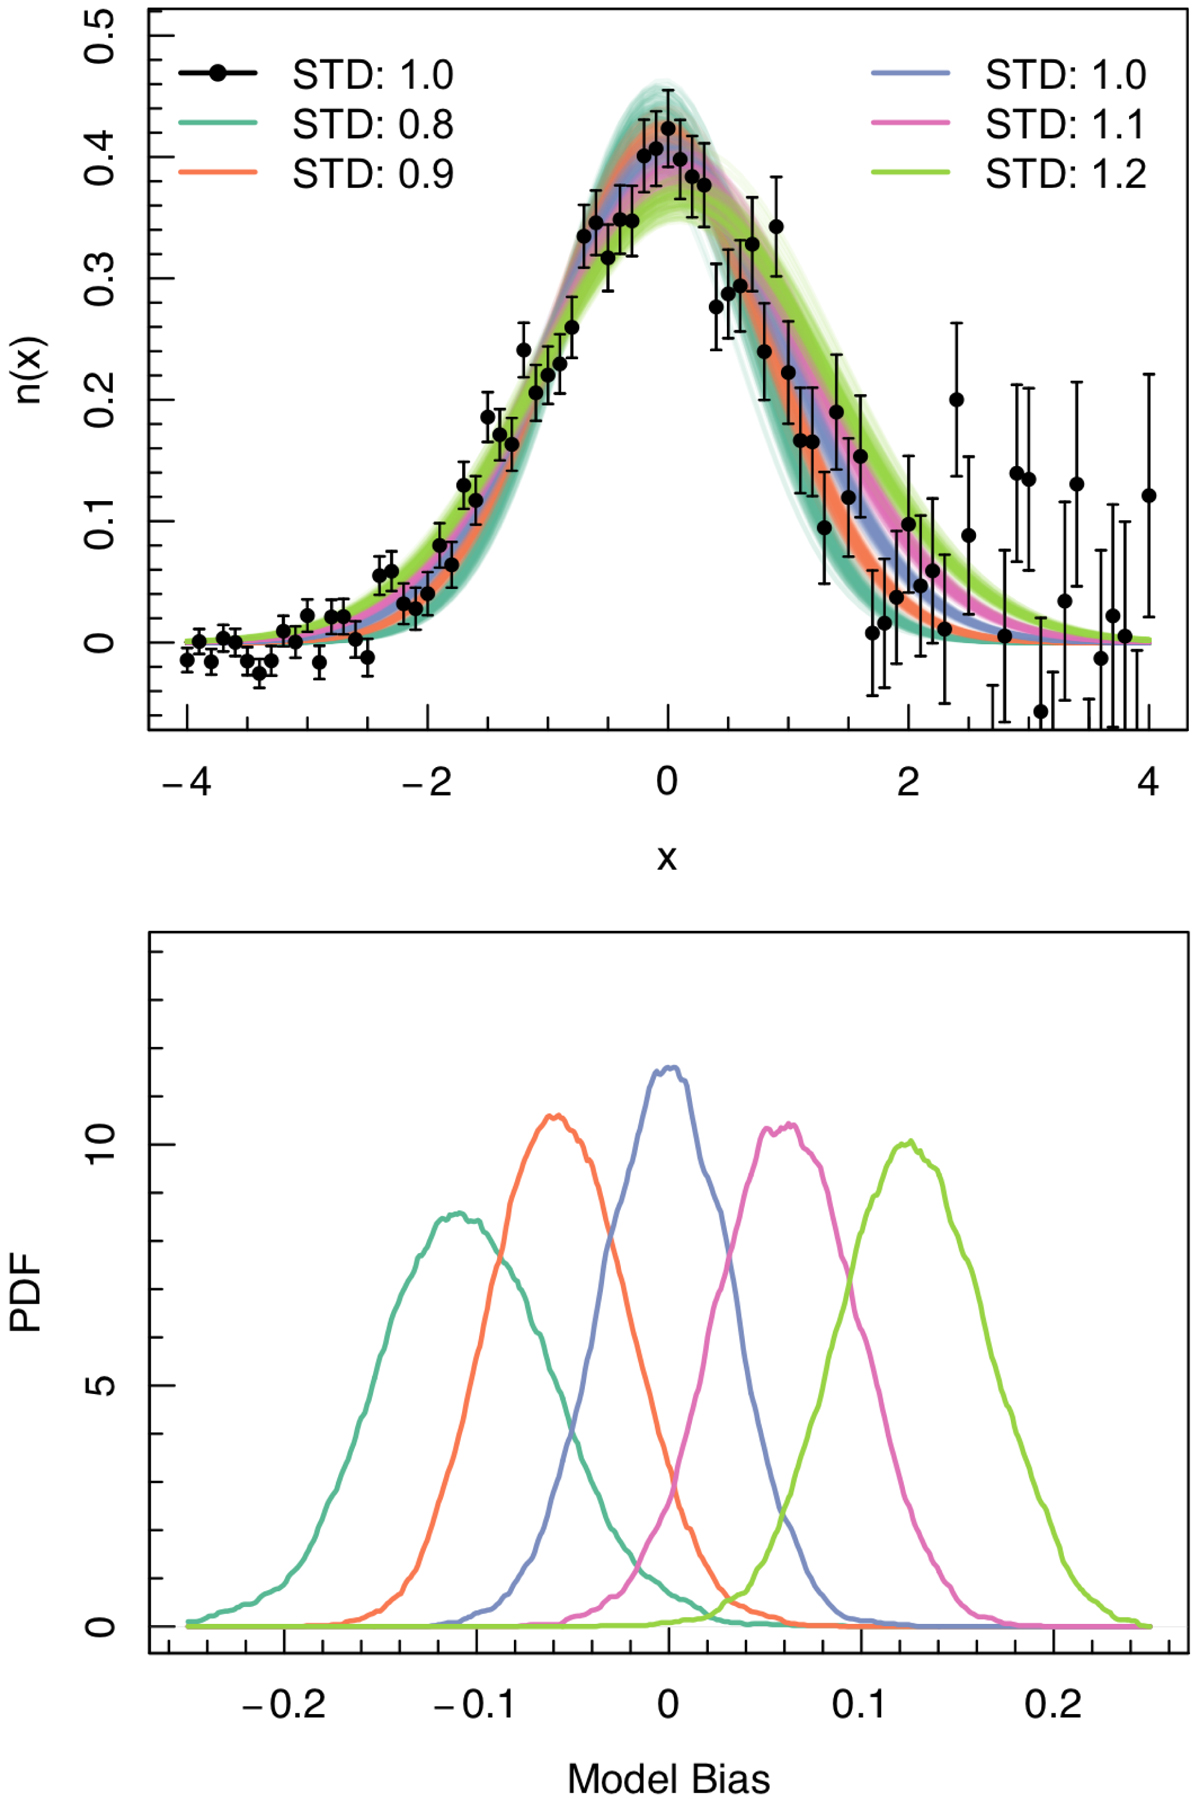
Toy model to illustrate the effect of variable S/N on model fits. Top: black data points correspond to one noise realisation with decreasing S/N. The blue lines correspond to fits with a model of perfect width whereas the teal and orange lines correspond to models that are to narrow and the magenta and green lines correspond to models that are too wide. Bottom: if the model has the correct width the mean of the best fit is on average unbiased (blue) whereas it is on average biased low if the model is too narrow (teal and orange) and biased high if the model is too broad (magenta and green).
Current usage metrics show cumulative count of Article Views (full-text article views including HTML views, PDF and ePub downloads, according to the available data) and Abstracts Views on Vision4Press platform.
Data correspond to usage on the plateform after 2015. The current usage metrics is available 48-96 hours after online publication and is updated daily on week days.
Initial download of the metrics may take a while.