Fig. 4.
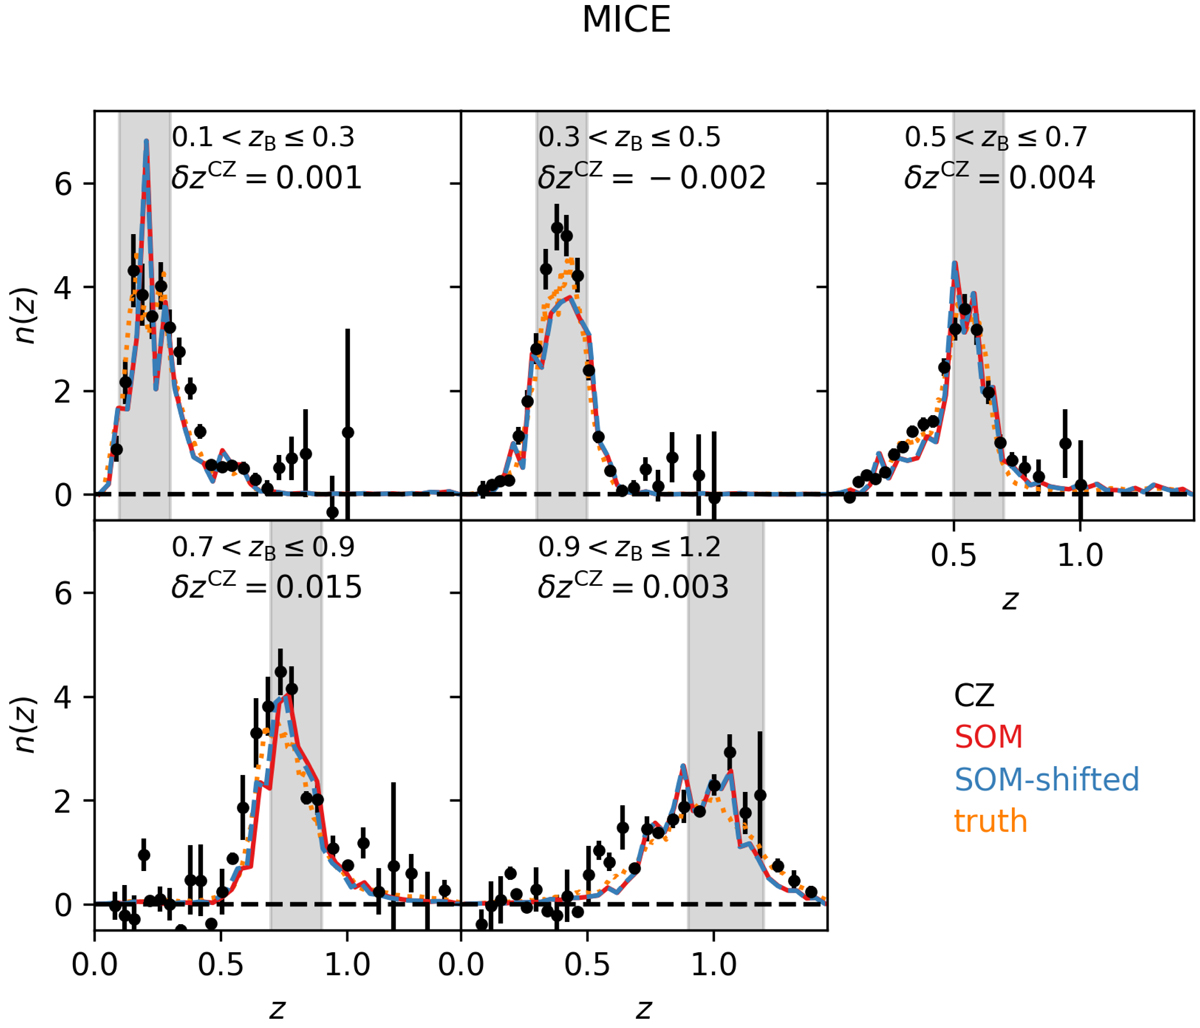
Clustering-z measurements on the MICE mocks with the fiducial setup, i.e. using the wide fields and scales of 100 kpc < r < 1 Mpc for the first three tomographic bins (top row) and the deep fields and scales of 30 kpc < r < 300 kpc for the upper two tomographic bins (bottom row). The original SOM redshift distributions from a representative line-of-sight are shown in solid red and the best-fit model is shown in dashed blue. The true redshift distributions are shown in dotted orange for comparison.
Current usage metrics show cumulative count of Article Views (full-text article views including HTML views, PDF and ePub downloads, according to the available data) and Abstracts Views on Vision4Press platform.
Data correspond to usage on the plateform after 2015. The current usage metrics is available 48-96 hours after online publication and is updated daily on week days.
Initial download of the metrics may take a while.