Fig. 3.
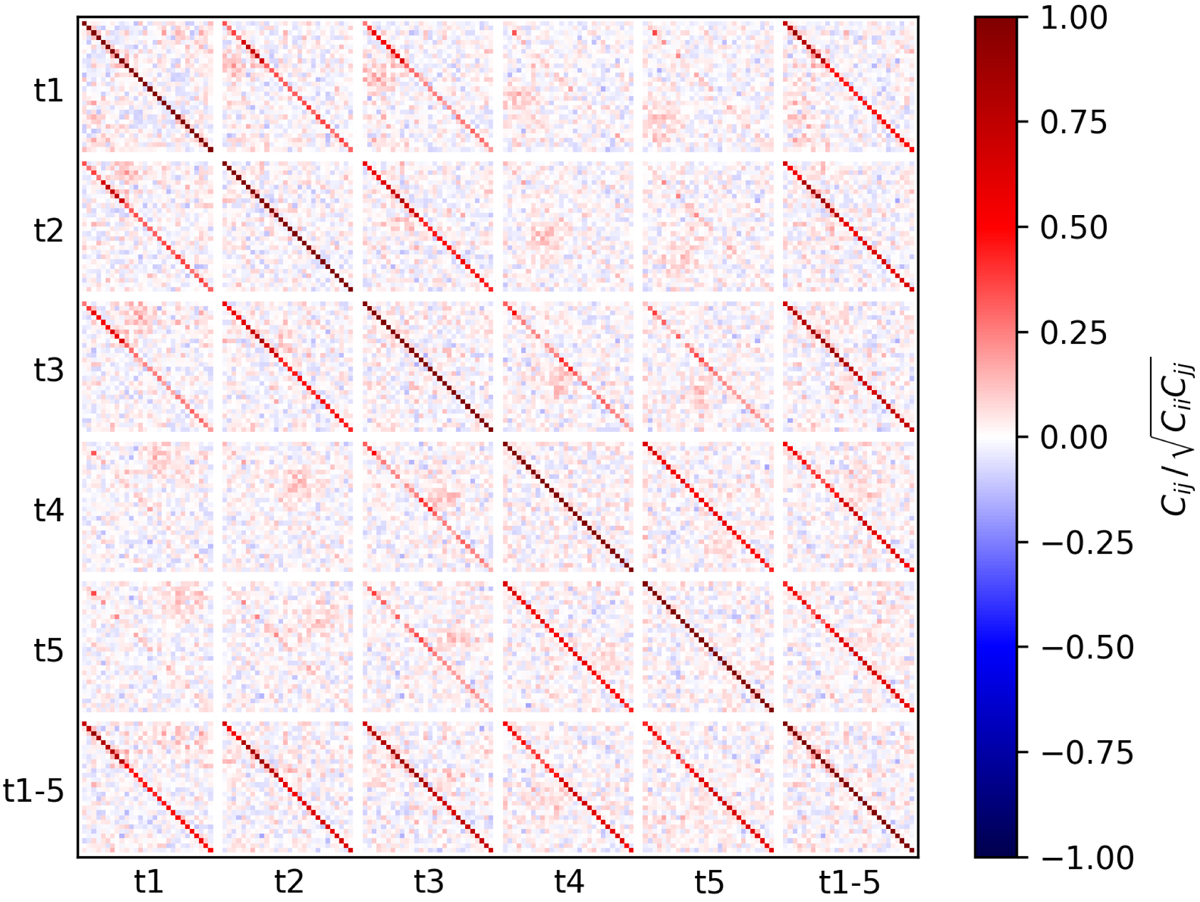
Correlation matrix of CZ measurements from the MICE mocks using an idealised reference sample with high number density. There are six blocks in a line, each 30 pixels wide corresponding to 30 redshift bins in the range 0 < z < 1.4 (with the first and last redshift bin containing no galaxies due to the redshift limits of MICE and shown white here). The first five blocks correspond to the five tomographic bins and the sixth block to the combined sample. The latter one is obviously correlated with all other samples as it shares target galaxies with the other bins.
Current usage metrics show cumulative count of Article Views (full-text article views including HTML views, PDF and ePub downloads, according to the available data) and Abstracts Views on Vision4Press platform.
Data correspond to usage on the plateform after 2015. The current usage metrics is available 48-96 hours after online publication and is updated daily on week days.
Initial download of the metrics may take a while.