Fig. 1.
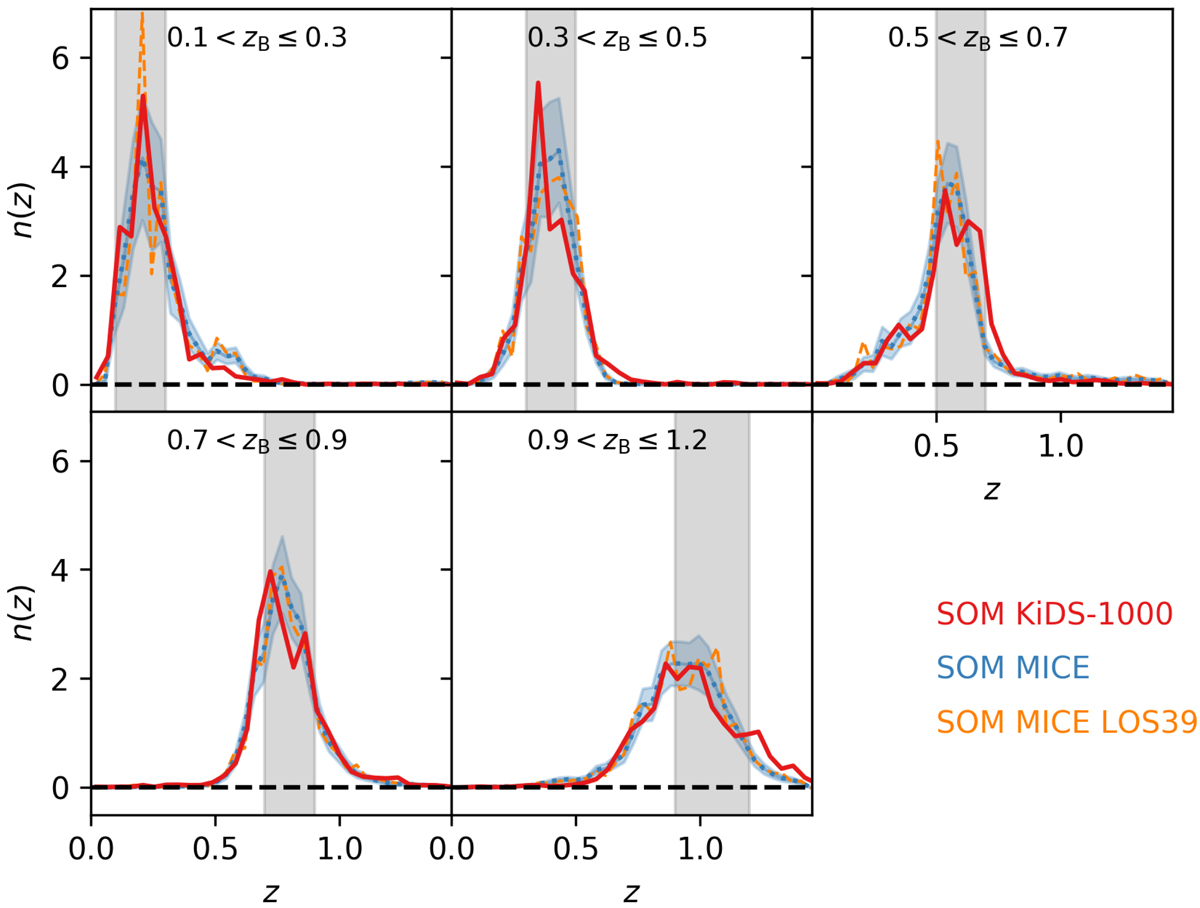
Redshift distributions for the five tomographic redshift bins used in the KiDS-1000 cosmological analyses estimated with the SOM method of Wright et al. (2019). The grey vertical bands indicate the photo-z cuts defining the bins. Solid red lines show the estimate from the KiDS-1000 data whereas the dotted blue lines and their confidence intervals represent the average and standard deviation of all lines-of-sight of the MICE mocks. The dashed orange lines show one representative (in terms of its mean redshifts) line-of-sight (number 39 in our list) that is used in Sect. 4.2.
Current usage metrics show cumulative count of Article Views (full-text article views including HTML views, PDF and ePub downloads, according to the available data) and Abstracts Views on Vision4Press platform.
Data correspond to usage on the plateform after 2015. The current usage metrics is available 48-96 hours after online publication and is updated daily on week days.
Initial download of the metrics may take a while.