Fig. 9.
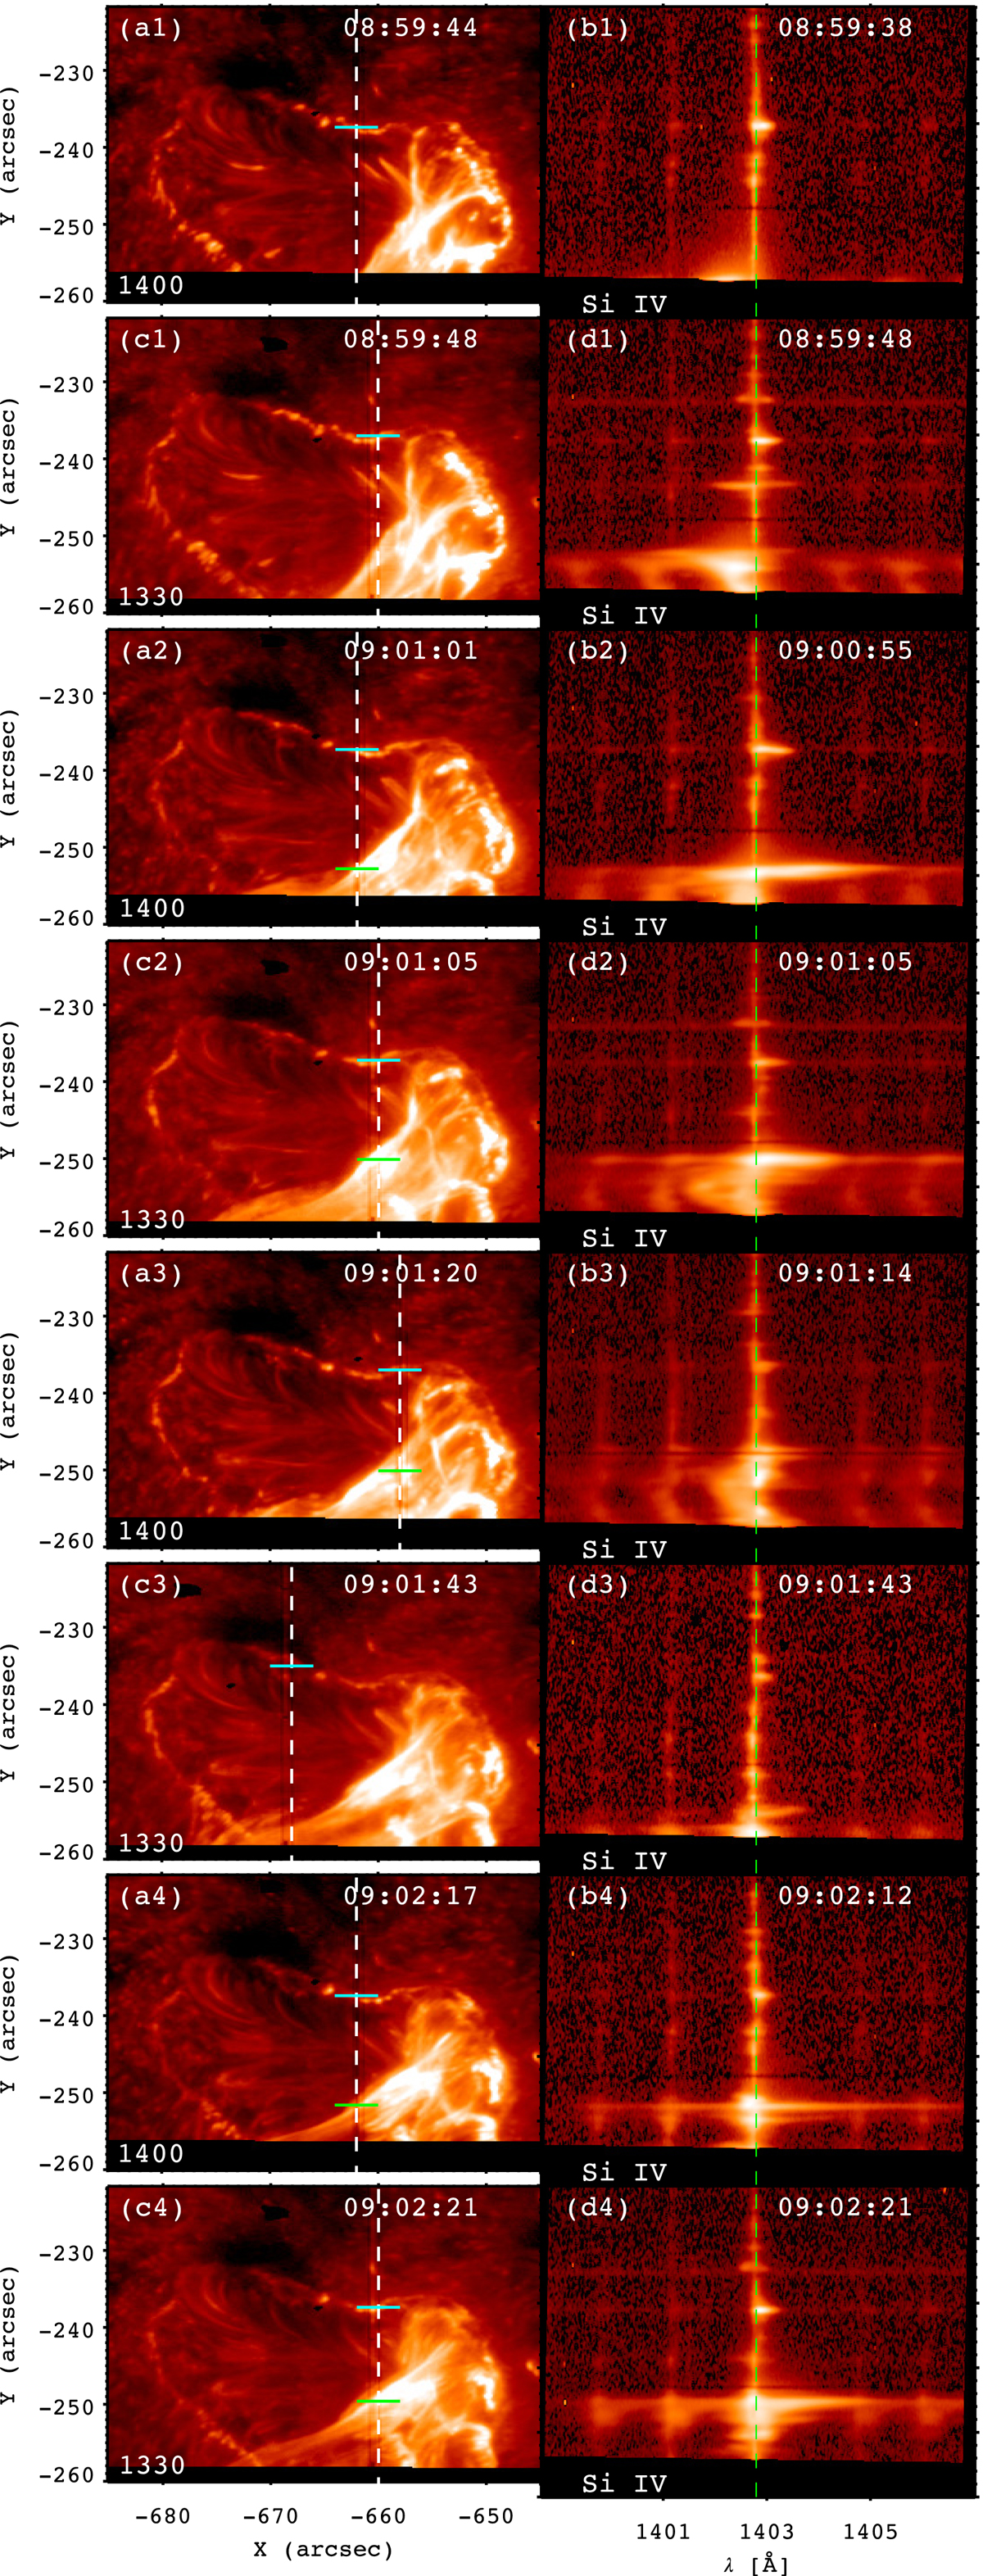
Selected FUV images observed by SJI (left panels) and the corresponding Si IV spectra of the slit (right panels). The white dashed lines represent the slit positions of raster observations. The short cyan lines mark the positions of ribbon for spectral fittings in Fig. 10. Panels a2–a4, c2, and c4: short green lines mark the positions of jet base for spectral fittings in Fig. 11. The green dashed lines represent the reference line center of Si IV.
Current usage metrics show cumulative count of Article Views (full-text article views including HTML views, PDF and ePub downloads, according to the available data) and Abstracts Views on Vision4Press platform.
Data correspond to usage on the plateform after 2015. The current usage metrics is available 48-96 hours after online publication and is updated daily on week days.
Initial download of the metrics may take a while.