Free Access
Fig. 5.
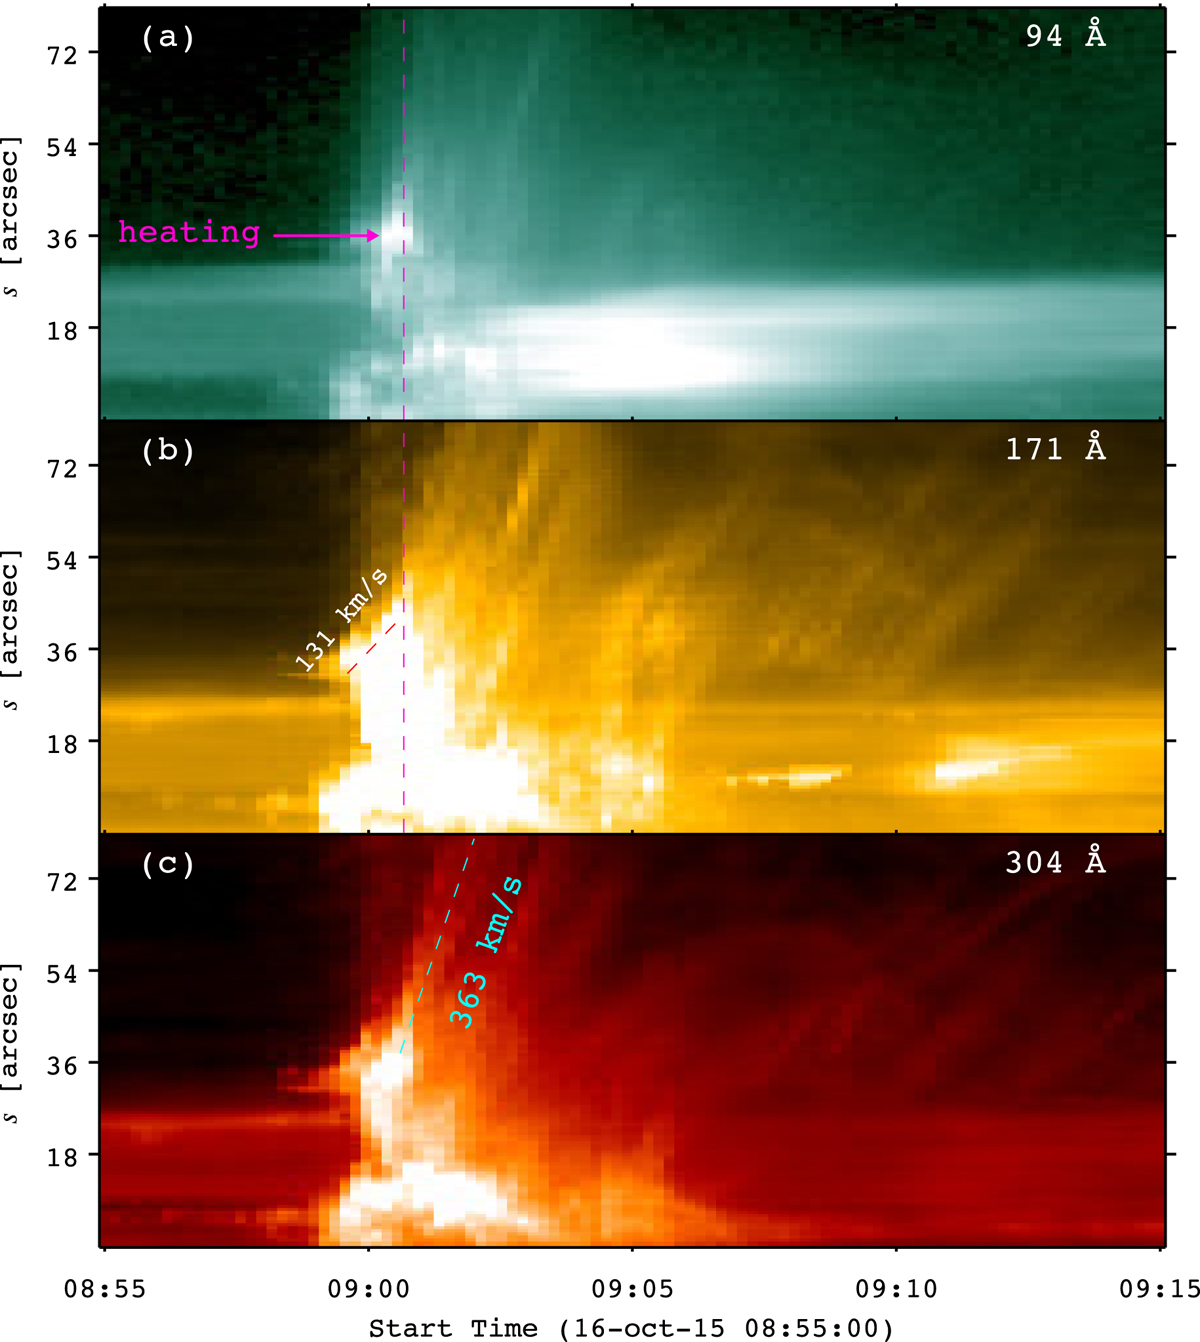
Time-distance diagrams of S1 in 94, 171, and 304 Å. The magenta dashed line denotes the time at 09:00:40 UT. The plane-of-sky speeds of the jet during the slow rise (∼131 km s−1) and fast rise (∼363 km s−1) are labeled. On the y-axis, s = 0 and ![]() denote the northwest and southeast endpoints of S1, respectively.
denote the northwest and southeast endpoints of S1, respectively.
Current usage metrics show cumulative count of Article Views (full-text article views including HTML views, PDF and ePub downloads, according to the available data) and Abstracts Views on Vision4Press platform.
Data correspond to usage on the plateform after 2015. The current usage metrics is available 48-96 hours after online publication and is updated daily on week days.
Initial download of the metrics may take a while.