Fig. 3.
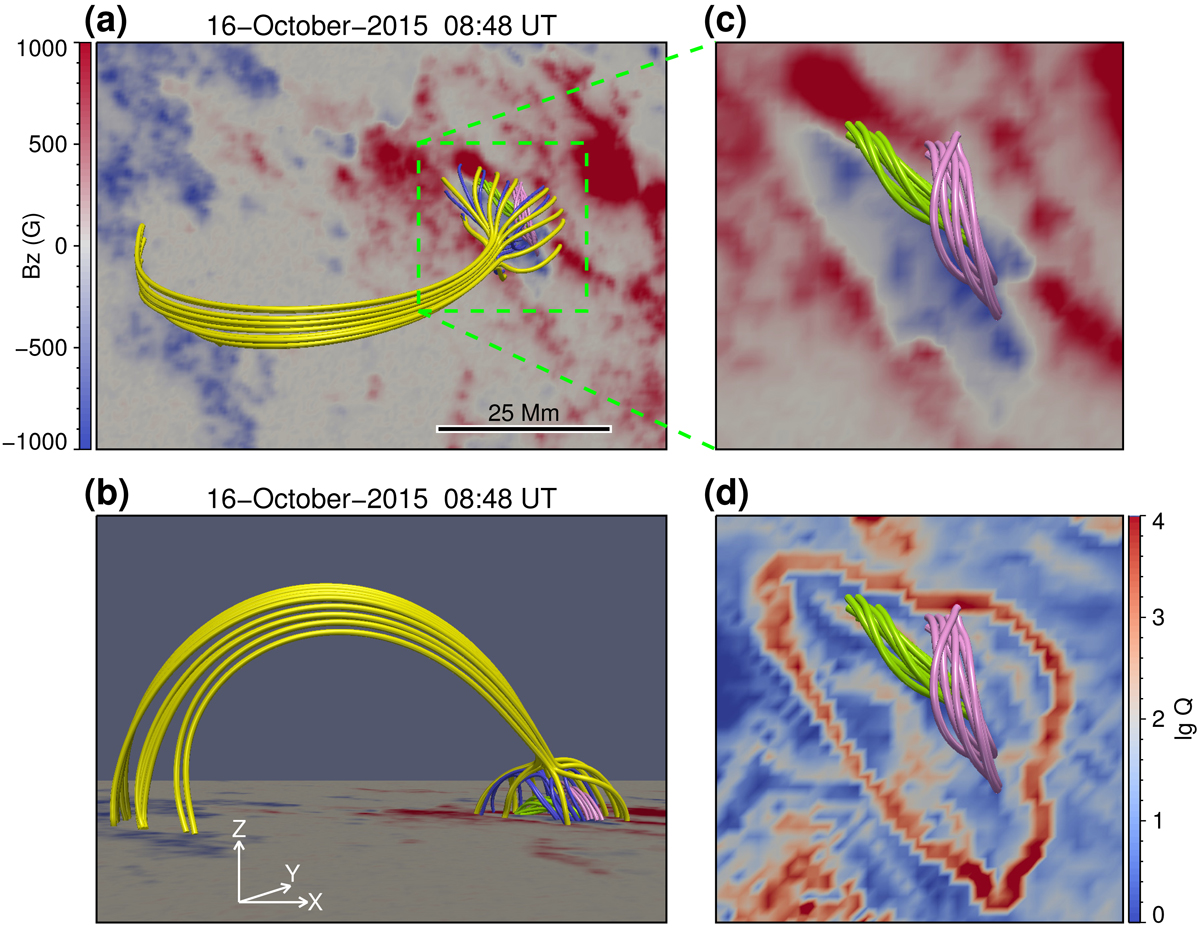
Top view (a) and side view (b) of the 3D magnetic configuration of AR 12434. The blue and yellow lines represent the fan-spine field lines. The green and light violet lines represent the field lines of F1 and F2, respectively. (c) Close-up of the flare region within the dashed box of panel a. (d) Spatial distribution of log Q at z = 0 within the flare region, which is overlapped with the field lines of F1 and F2. The 3D magnetic configuration from different perspectives is shown in a movie (anim3d.mov) available online.
Current usage metrics show cumulative count of Article Views (full-text article views including HTML views, PDF and ePub downloads, according to the available data) and Abstracts Views on Vision4Press platform.
Data correspond to usage on the plateform after 2015. The current usage metrics is available 48-96 hours after online publication and is updated daily on week days.
Initial download of the metrics may take a while.