Fig. 2.
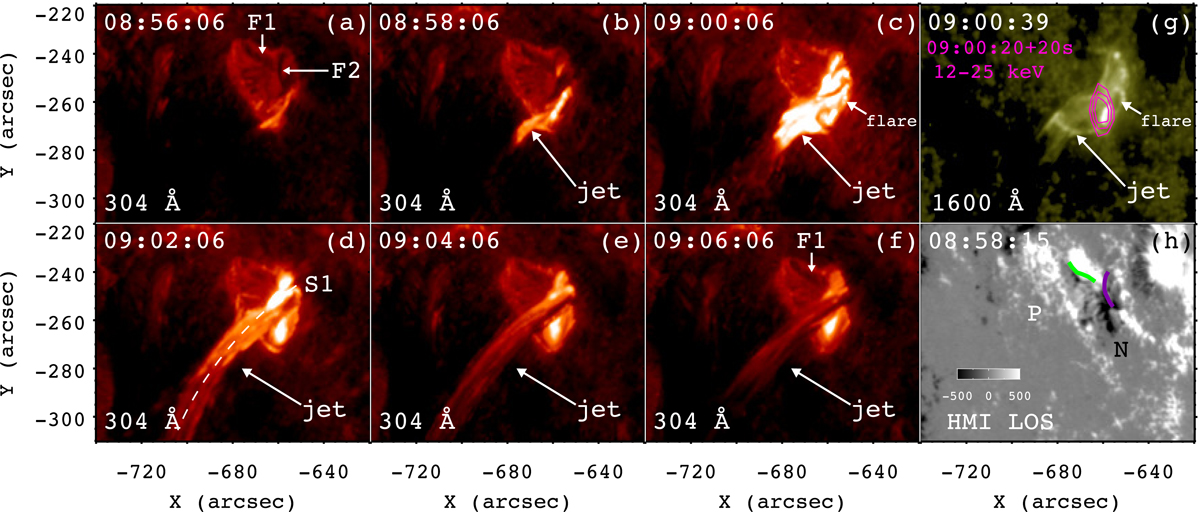
(a − f) Snapshots of the AIA 304 Å images. The arrows point to two minifilaments (F1 and F2), flare, and jet. Panel d: the curved slice (S1) is used to investigate the radial propagation of the jet. (g) AIA 1600 Å image at 09:00:39 UT. The intensity contours of the HXR image are superposed with magenta lines. (h) HMI LOS magnetogram at 08:58:15 UT. The thick green and purple lines represent F1 and F2 in panel a. The whole evolution of the event observed in 304 Å is shown in a movie (anim304.mov) available online.
Current usage metrics show cumulative count of Article Views (full-text article views including HTML views, PDF and ePub downloads, according to the available data) and Abstracts Views on Vision4Press platform.
Data correspond to usage on the plateform after 2015. The current usage metrics is available 48-96 hours after online publication and is updated daily on week days.
Initial download of the metrics may take a while.