Fig. 13.
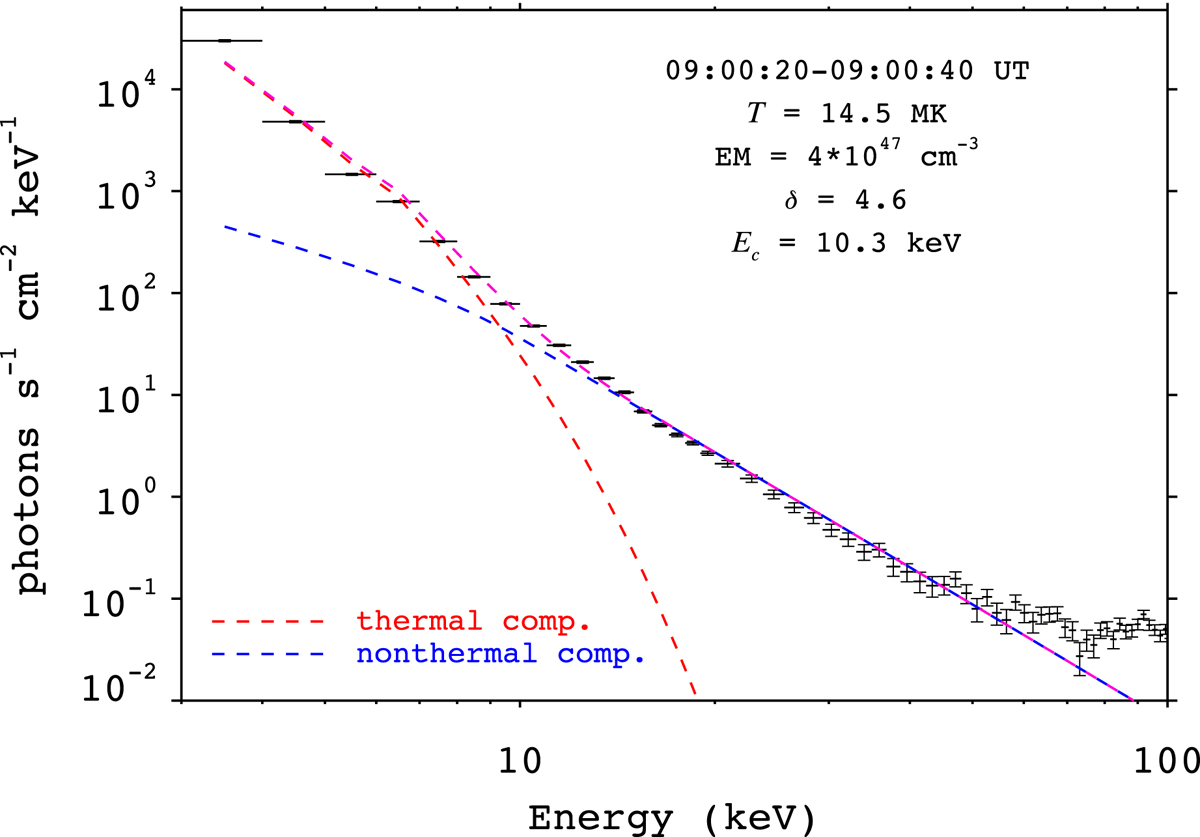
Results of RHESSI spectral fitting during 09:00:20−09:00:40 UT. The data points with horizontal and vertical error bars represent the observed data. The spectra for thermal and nonthermal component are plotted with red and blue dashed lines, respectively. The sum of two components is shown with a magenta dashed line. The fitted parameters, including the thermal temperature (T), emission measure (EM), electron spectral index (δ), and low-energy cutoff (Ec), are labeled.
Current usage metrics show cumulative count of Article Views (full-text article views including HTML views, PDF and ePub downloads, according to the available data) and Abstracts Views on Vision4Press platform.
Data correspond to usage on the plateform after 2015. The current usage metrics is available 48-96 hours after online publication and is updated daily on week days.
Initial download of the metrics may take a while.