Fig. 7.
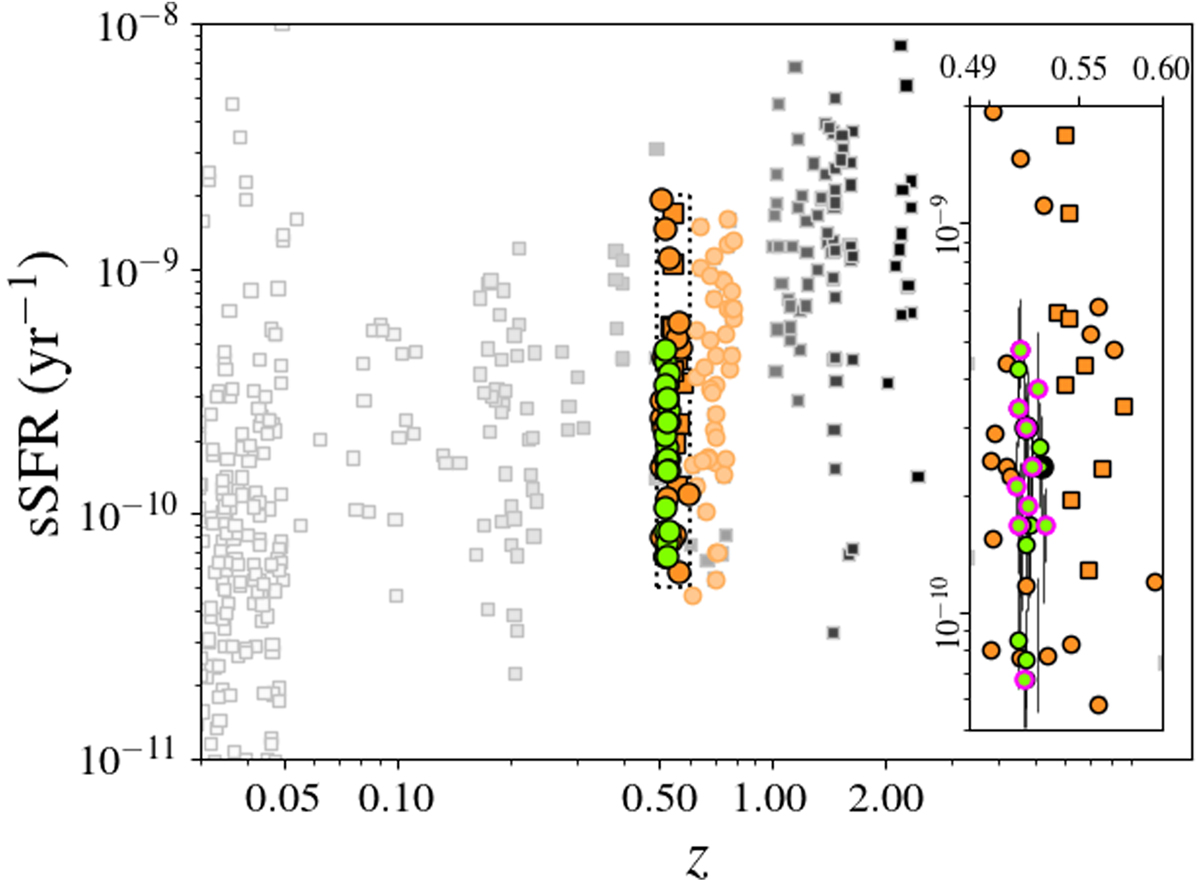
Specific star formation rates as a function of redshift. The green dots identify our ALMA targets; dots with the thick black borders are the galaxies detected at 24 μm, and dots with the pink outlines galaxies with low gas fraction. The orange circles stand for the PHIBSS2 galaxies, with the darker shade for the systems at 0.49 ≤ z ≤ 0.6 and the lighter for the galaxies at 0.6 < z ≤ 0.8. The orange squares indicate the M0717 LIRGs. The symbols in shades of grey are for the samples we pulled from the literature at different redshifts. We provide a zoom-in of the region delineated by the dotted lines (see inset), around the redshift of CL1411.1−1148. While three of the PHIBSS2 sources have sSFRs well above those of our ALMA targets, the sSFRs of the rest of the PHIBSS2 sources are in perfect agreement with those from our sample.
Current usage metrics show cumulative count of Article Views (full-text article views including HTML views, PDF and ePub downloads, according to the available data) and Abstracts Views on Vision4Press platform.
Data correspond to usage on the plateform after 2015. The current usage metrics is available 48-96 hours after online publication and is updated daily on week days.
Initial download of the metrics may take a while.