Fig. 5.
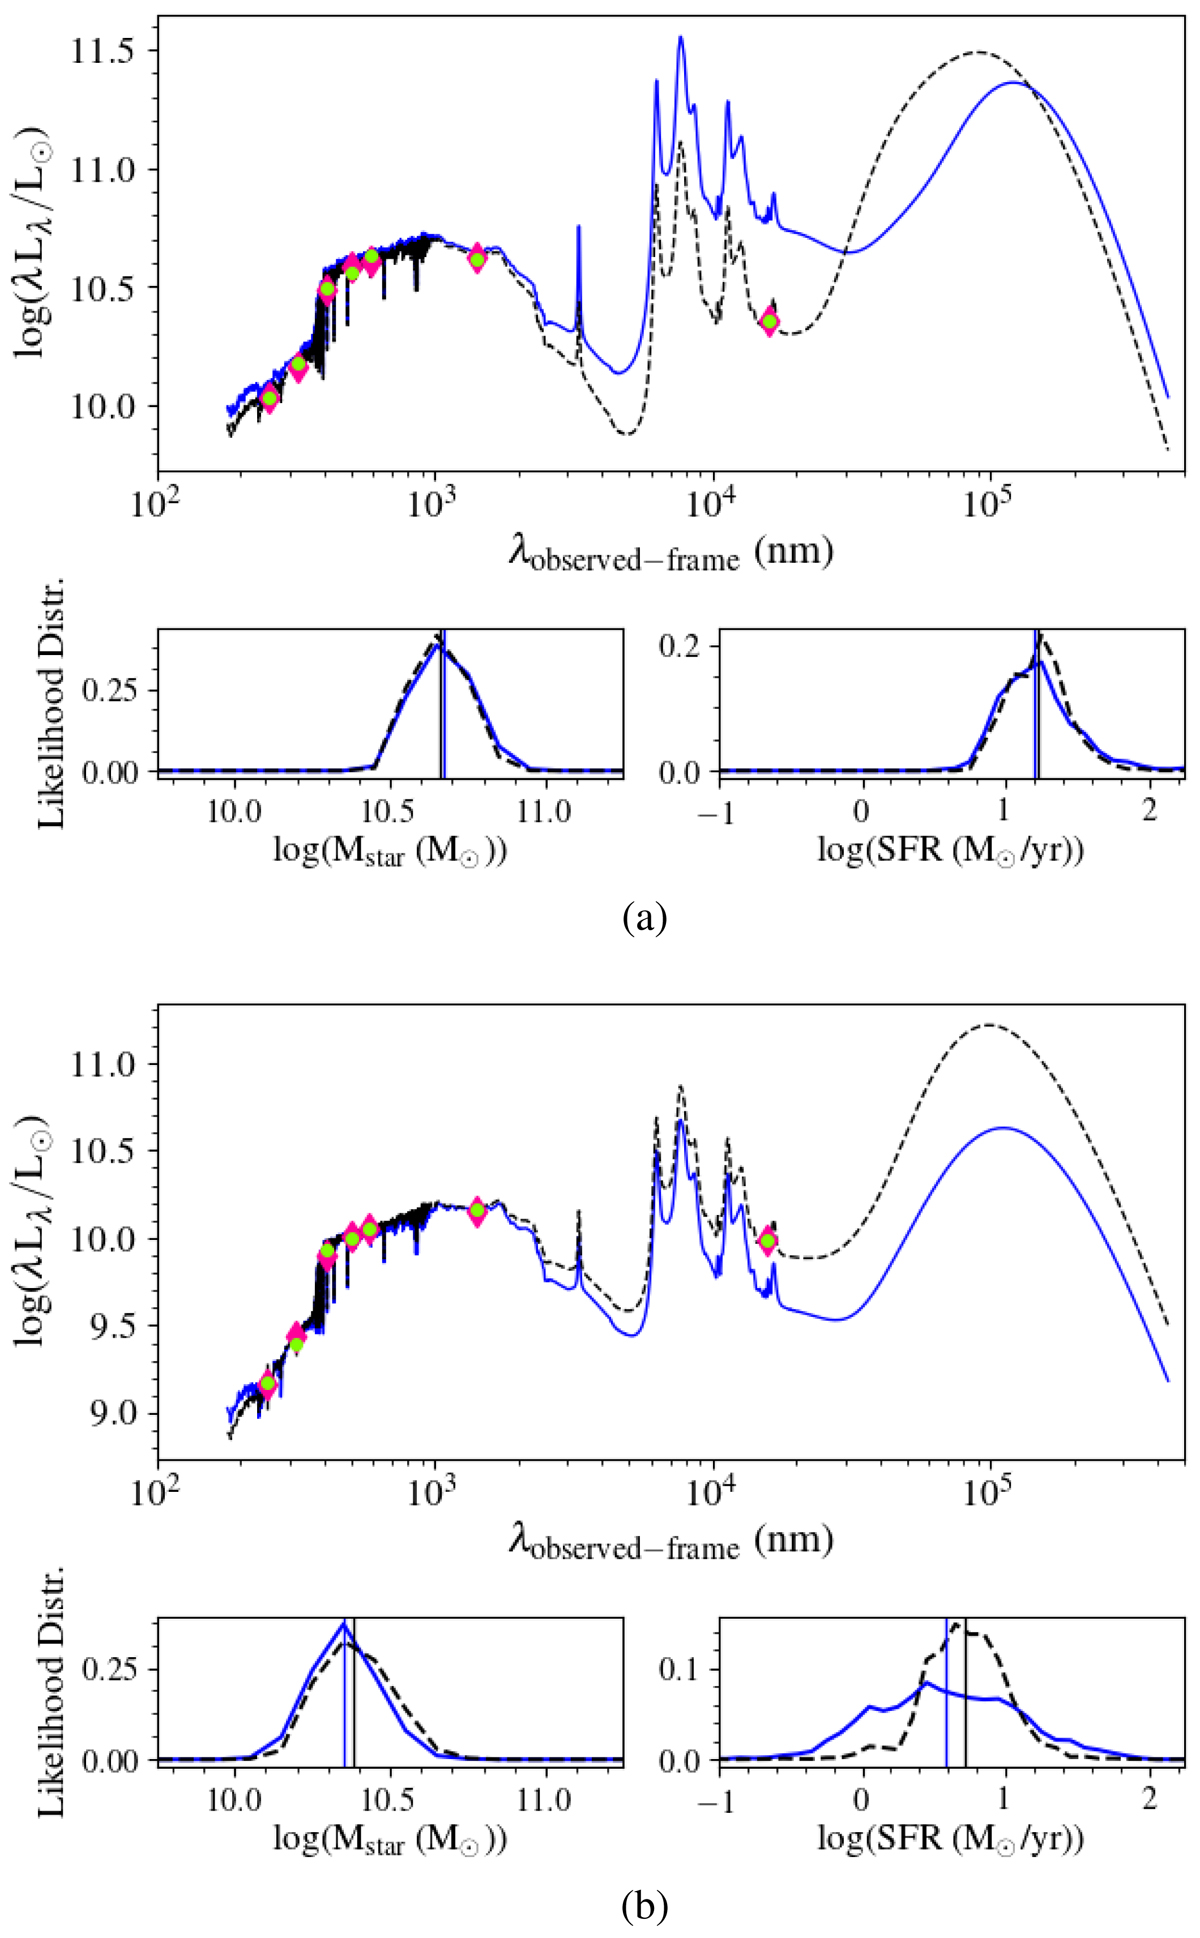
SEDs and likelihood distributions for the two Spitzer-observed galaxies: EDCSNJ1411028–1147006 (a) and EDCSNJ1411036–1148506 (b). The blue curves are without the MIPS 24 μm fluxes and the black dashed curves are with the MIPS 24 μm fluxes. The top panels show the fitted SEDs in black and blue, the observed fluxes in green, and the model fluxes in pink. The bottom panels of (a) and (b) show the likelihood distributions for Mstar and SFR, and the medians for the Mstar and SFR, as the blue and black vertical lines, derived with MAGPHYS.
Current usage metrics show cumulative count of Article Views (full-text article views including HTML views, PDF and ePub downloads, according to the available data) and Abstracts Views on Vision4Press platform.
Data correspond to usage on the plateform after 2015. The current usage metrics is available 48-96 hours after online publication and is updated daily on week days.
Initial download of the metrics may take a while.