Fig. 4.
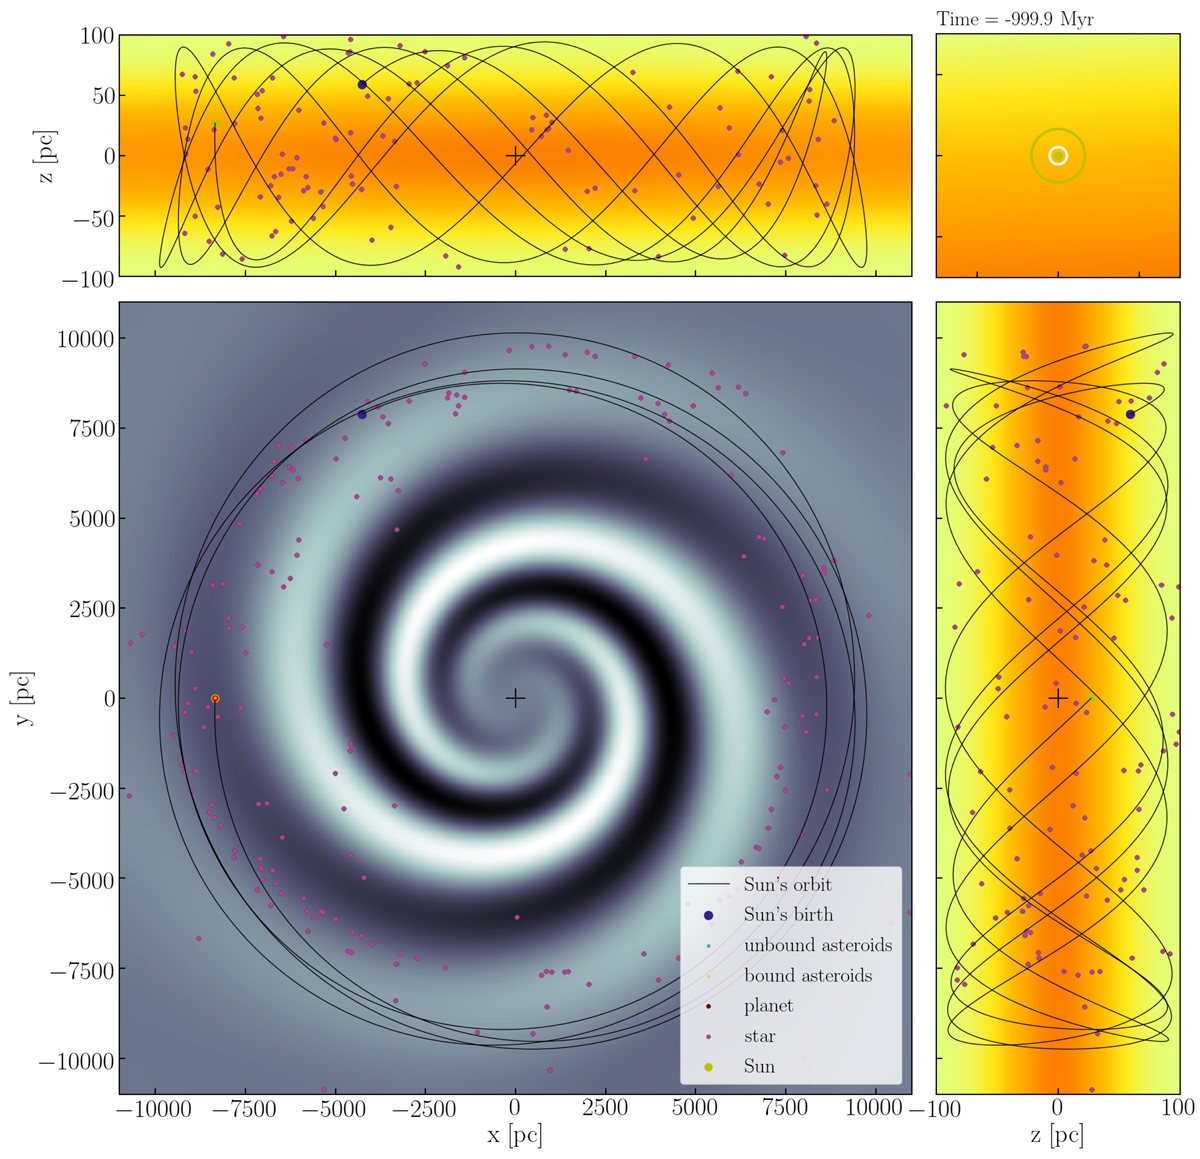
Positions of the 200 stars at their birth location in the potential of the Galaxy 1.0 Gyr before the present. The solid curve shows the orbit of the Sun for the last gigayear. The colored background represents the adopted Galaxy potential: bottom left, top left, and bottom right: various Cartesian coordinates. The spiral structure is visible in the X − Y plane (lower left), whereas the other two panels give only an edge-on view of the Galaxy. The starting position of the Sun is indicated with the black studs, and its end position is market with a yellow studs. The planets and asteroids of all the nearby stars overlap at this initial snapshot because the planetary systems are smaller than the symbol-size in the panels. Top-right corner panel: a magnified view of 6 × 6 pc around the Sun. The outer circle shows the Hill radius at ∼0.65 pc, and the inner circle represents the inner edge of the Oort cloud at about ∼0.05 pc. In this initial image, none of the stars are within 6 pc of the Solar System. The color gradient in the top-right panel shows the local variation in the Galactic potential.
Current usage metrics show cumulative count of Article Views (full-text article views including HTML views, PDF and ePub downloads, according to the available data) and Abstracts Views on Vision4Press platform.
Data correspond to usage on the plateform after 2015. The current usage metrics is available 48-96 hours after online publication and is updated daily on week days.
Initial download of the metrics may take a while.