Fig. 3.
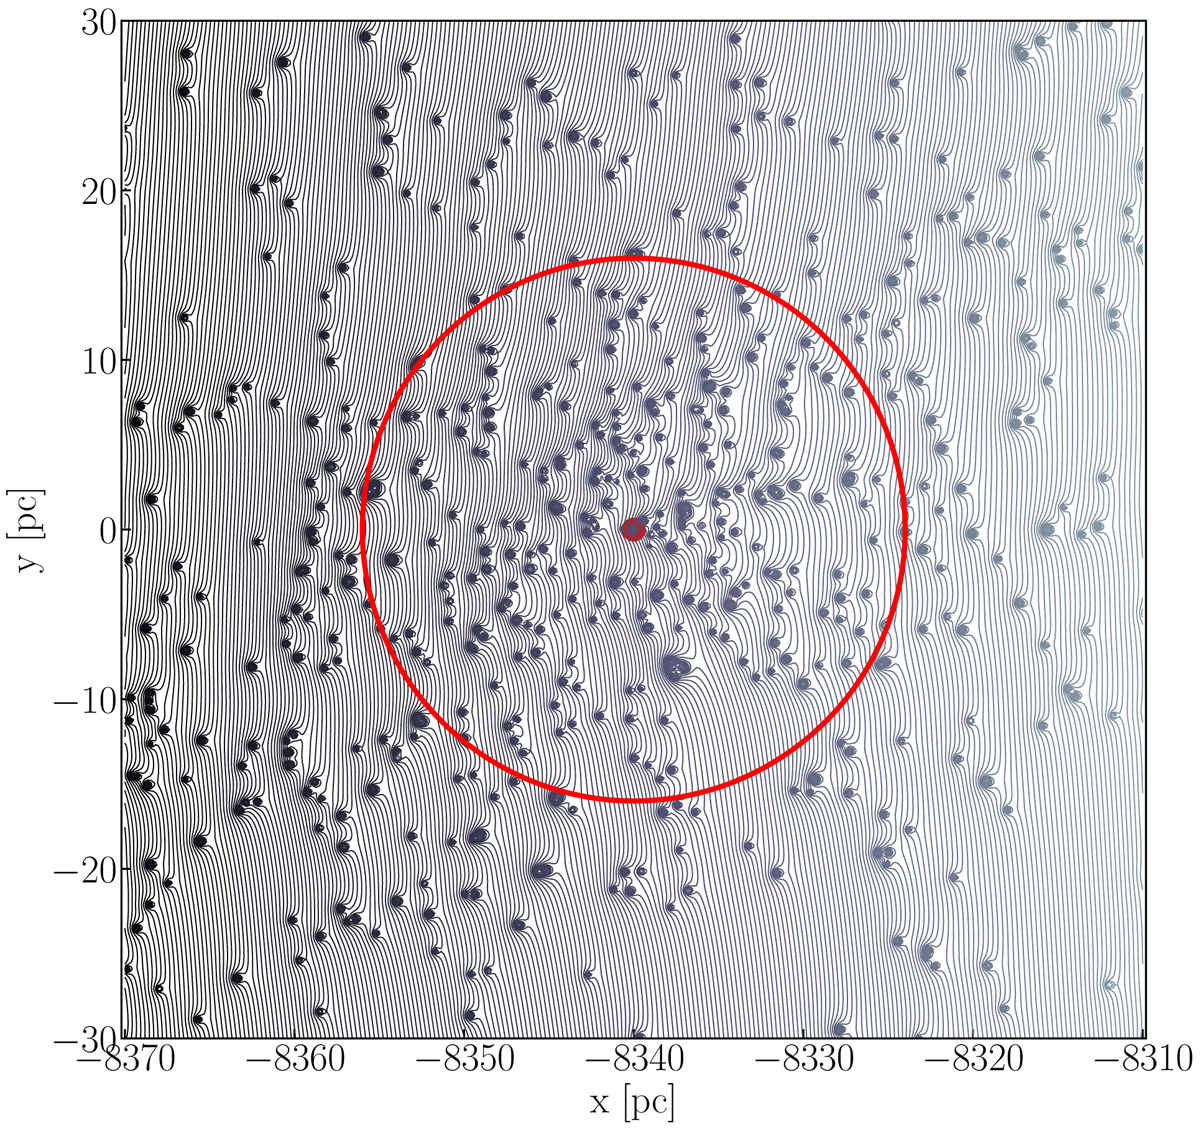
Equipotential surface of ∼795 stars within 50 pc of the Sun projected on the xy-plane in the Galactic potential. To make the potential more visible, we magnified the stellar masses by a factor 300. The Sun is indicated with the red dot in the middle of the figure. The red circle at ∼16 pc indicates the inner region for which the analysis in this paper is performed. This volume contains the 200 nearest stars (Torres et al. 2019b). The script to generate this image, plot_nearby_stars_equipotential_surface.py, and the required data (filename gaia_nearby_stars.amuse), are both available at figshare.
Current usage metrics show cumulative count of Article Views (full-text article views including HTML views, PDF and ePub downloads, according to the available data) and Abstracts Views on Vision4Press platform.
Data correspond to usage on the plateform after 2015. The current usage metrics is available 48-96 hours after online publication and is updated daily on week days.
Initial download of the metrics may take a while.