Free Access
Fig. 12.
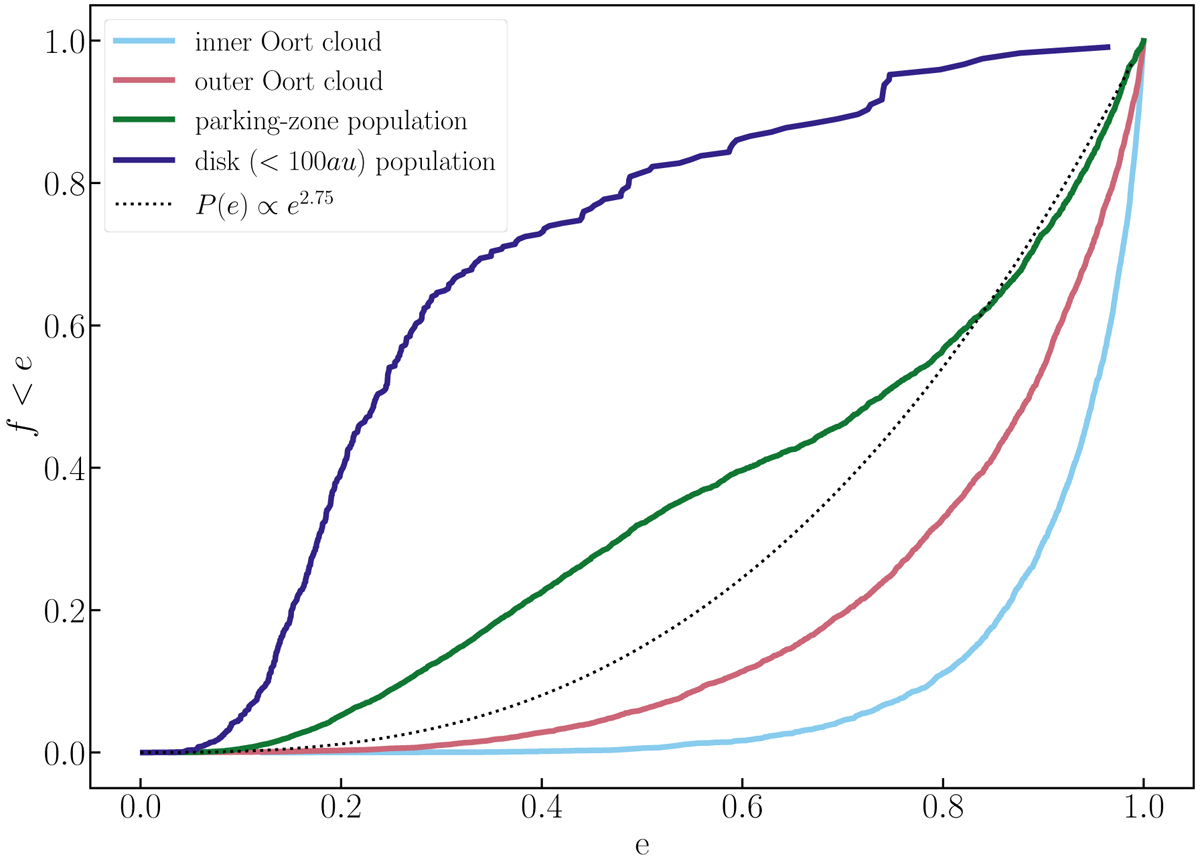
Cumulative distribution of the eccentricity in the inner and outer Oort cloud at an age of 50 Myr after the start of the simulations. The additional green curve gives the final distribution of P(e) ∝ e2.75. The simulated eccentricity distribution approaches the theoretical curve at about 50 Myr.
Current usage metrics show cumulative count of Article Views (full-text article views including HTML views, PDF and ePub downloads, according to the available data) and Abstracts Views on Vision4Press platform.
Data correspond to usage on the plateform after 2015. The current usage metrics is available 48-96 hours after online publication and is updated daily on week days.
Initial download of the metrics may take a while.