Fig. 11.
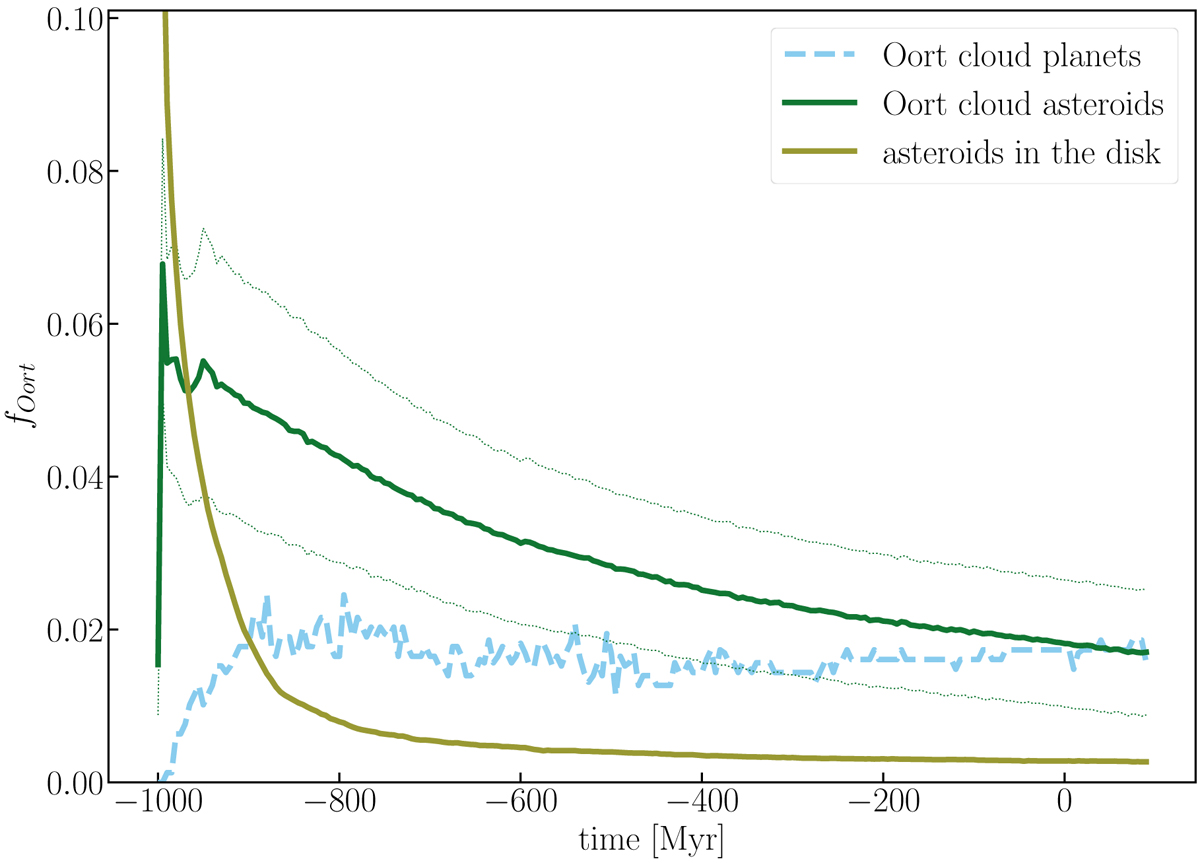
Evolution of the fraction of asteroids in the Oort cloud of their respective host stars (solid green curve). The dotted curves give the dispersion (one standard deviation) among stars. The blue dashed curve gives the fraction of planets that populate the Oort cloud. The ocher-colored curve gives the fraction that remains in the disk either in resonant orbits or in the parking zone (outside the perturbing influence of the planets).
Current usage metrics show cumulative count of Article Views (full-text article views including HTML views, PDF and ePub downloads, according to the available data) and Abstracts Views on Vision4Press platform.
Data correspond to usage on the plateform after 2015. The current usage metrics is available 48-96 hours after online publication and is updated daily on week days.
Initial download of the metrics may take a while.