Fig. 10.
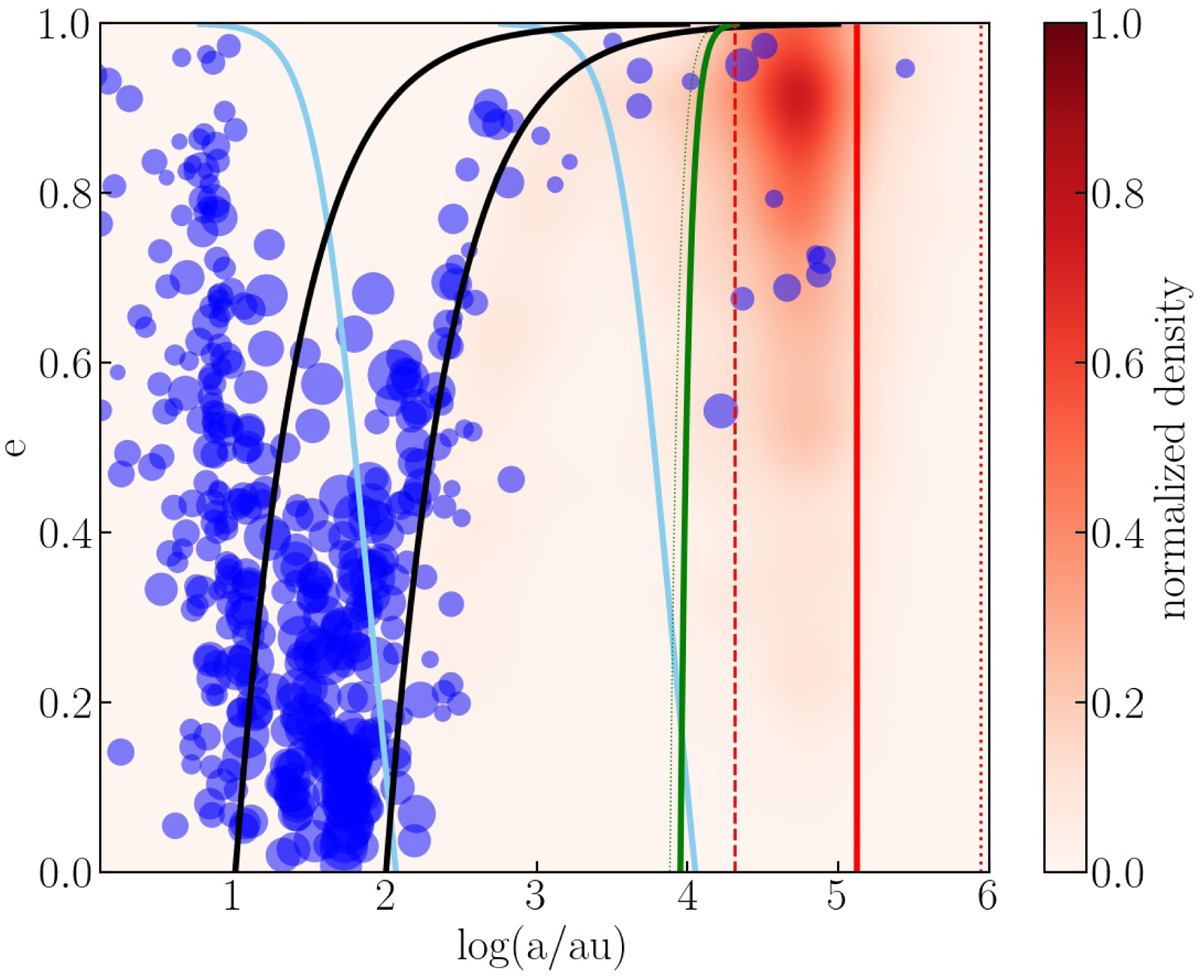
Orbital parameters of planets (blue spots) and 141864 asteroids (red fuzz) at 1 Gyr after the start of the simulation. The various curves are described in Fig. 1. The size of each blue point is proportional to the mass of the planet it represents. The two black curves indicate the pericenter distances associated with these minimum and maximum initial orbital separations, indicating the limits of the conveyor belt. The minor bodies are presented as small red points. In Fig. 1 we present the initial conditions, and explain the terminology.
Current usage metrics show cumulative count of Article Views (full-text article views including HTML views, PDF and ePub downloads, according to the available data) and Abstracts Views on Vision4Press platform.
Data correspond to usage on the plateform after 2015. The current usage metrics is available 48-96 hours after online publication and is updated daily on week days.
Initial download of the metrics may take a while.