Fig. 1.
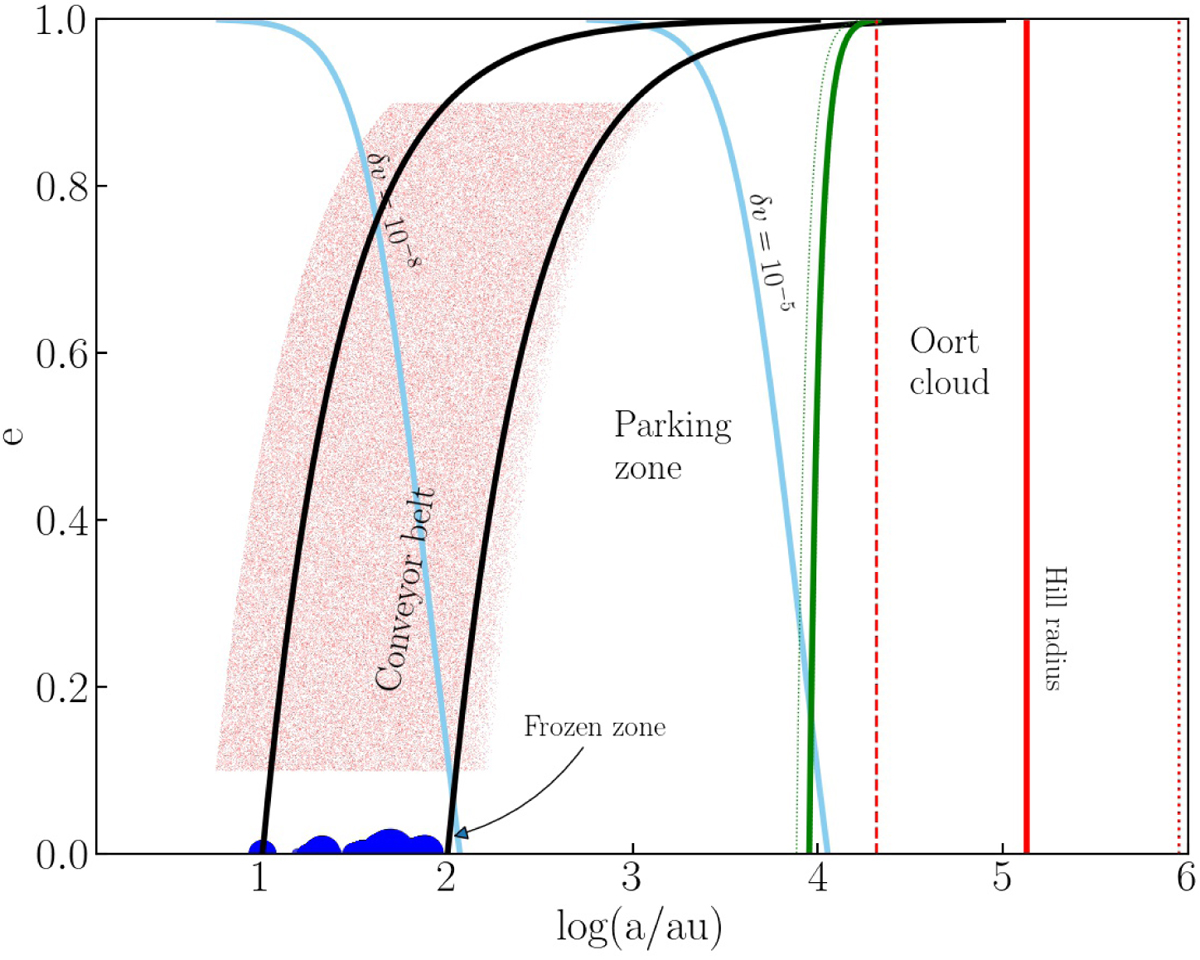
Orbital parameters of planets (blue studs) and 141864 asteroids (red points) around the 200 nearest stars 1 Gyr ago. Here the right-most light-blue curve gives the approximate inner edge of the Oort cloud using a mean local stellar mass of ∼1.0 M⊙ and a mean distance according to the Sun’s Hill radius in the Galatic potential (∼0.65 pc, red vertical line). The vertical dashed and dotted curves give the smallest and largest Hill radii experienced by any star throughout the simulations. The inner light-blue curve is given for a relative perturbation of δv = 10−8, and the outer light-blue curve gives δv = 10−5. The green curve gives the distance from the host star for which the circularization timescale of the Galactic tidal field is comparable to the eccentricity pumping timescale of a test particle in the conveyor belt. The orbital configuration at the present epoch, 1 Gyr after the start of the simulation, is presented here. This figure is generated with the Python script plot_semimajor_axis_vs_eccentricity_of_planets_and_comets.py. This script, the required data, and the scripts to generate any of the figures in this manuscript including all required data are available through figshare.
Current usage metrics show cumulative count of Article Views (full-text article views including HTML views, PDF and ePub downloads, according to the available data) and Abstracts Views on Vision4Press platform.
Data correspond to usage on the plateform after 2015. The current usage metrics is available 48-96 hours after online publication and is updated daily on week days.
Initial download of the metrics may take a while.