| Issue |
A&A
Volume 647, March 2021
|
|
|---|---|---|
| Article Number | C3 | |
| Number of page(s) | 10 | |
| Section | Interstellar and circumstellar matter | |
| DOI | https://doi.org/10.1051/0004-6361/202038534e | |
| Published online | 15 March 2021 | |
GIARPS High-resolution Observations of T Tauri stars (GHOsT)
II. Connecting atomic and molecular winds in protoplanetary disks (Corrigendum)
1
INAF – Osservatorio Astronomico di Roma – Via Frascati 33,
00078
Monte Porzio Catone,
Italy
e-mail: This email address is being protected from spambots. You need JavaScript enabled to view it.
2
INAF – Osservatorio Astronomico di Capodimonte – Salita Moiariello 16,
80131
Napoli, Italy
3
INAF – Osservatorio Astrofisico di Catania – Via S. Sofia 78,
95123
Catania, Italy
4
INAF - Osservatorio Astronomico di Padova,
Via dell’Osservatorio 8,
36012
Asiago (VI), Italy
5
Central Astronomical Observatory of Pulkovo,
Pulkovskoe shosse 65,
196140
St. Petersburg,
Russia
6
Fundación Galileo Galilei – INAF – Telescopio Nazionale Galileo,
38700
Breña Baja,
Santa Cruz de Tenerife, Spain
7
European Southern Observatory,
Karl-Schwarzschild-Strasse 2,
85748
Garching bei München, Germany
8
INAF - Osservatorio Astronomico di Padova,
vicolo dell’ Osservatorio 5,
35122
Padova, Italy
Key words: stars: pre-main sequence / stars: winds, outflows / techniques: spectroscopic / line: profiles / errata, addenda
Due to a wrong conversion of flux units in the infrared (IR) spectral range, the H2 profiles were erroneously reported with a flux a factor of 10 higher than the correct one.
The values of the H2 peak intensities, fluxes, and luminosities in Tables 3, 4, and A.1 have now been corrected. Here we also publish Figs. 1, 2, 5, 6, 7, and A.1 with the correct flux scale.
Consequently, the second paragraph of Sect. 5.3, should read as follows: “From Fig. 5 we see that about half of the sources where H2 has been detected have a similar H2 and [OI] luminosity, while in the other half of the sample the H2 luminosity is significantly lower than the [OI] luminosity.”
Acknowledgements
We are grateful to Christian Rab for pointing out the error in our manuscript.
© ESO 2021
All Tables
Line kinematic parameters of the Gaussian components having |v| > 30 km s −1 for the [O I] and H2 profiles.
All Figures
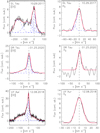 |
Fig. 1 Example of Gaussian decomposition of continuum-subtracted [O I] and H2 line profiles (black lines). The fit to the profile is in red, while single components are shown with blue dashed lines. Flux units are 10−15 erg s−1 cm−2 Å−1. For each panel, the target name and date of observation (MM.DD.YYYY) are indicated. The complete sample is reported in Fig. A.1. |
| In the text | |
 |
Fig. 2 Continuum-subtracted H2 line profiles variability for DO Tau, DL Tau, HN Tau, DG Tau, CW Tau, DF Tau and RY Tau. Flux units are 10−15 ergs−1 cm−2 Å−1. |
| In the text | |
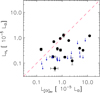 |
Fig. 5 Correlations between extinction-corrected luminosities of the [O I] and H2 NLVC. The red dashed line represents the one-to-one correlation. Upper limits are indicated with blue arrows. |
| In the text | |
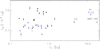 |
Fig. 6 Correlation between star luminosities and extinction-corrected luminosities of the H2 NLVC. Upper limits are indicated with blue arrows. |
| In the text | |
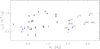 |
Fig. 7 Correlation between star masses and extinction-corrected luminosities of the H2 NLVC. Upper limits are indicated with blue arrows. |
| In the text | |
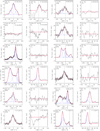 |
Fig. A.1 Continuum-subtracted [O I] and H2 line profiles. Thefit to the profile is in red, which was obtained by adding single or multiple Gaussians (blue dashed lines). Flux units are 10−15 ergs−1 cm−2 Å−1. For each panel, the target name and date of observation (MM.DD.YYYY) are indicated. |
| In the text | |
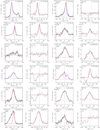 |
Fig. A.1 continued. |
| In the text | |
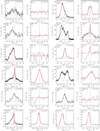 |
Fig. A.1 continued. |
| In the text | |
Current usage metrics show cumulative count of Article Views (full-text article views including HTML views, PDF and ePub downloads, according to the available data) and Abstracts Views on Vision4Press platform.
Data correspond to usage on the plateform after 2015. The current usage metrics is available 48-96 hours after online publication and is updated daily on week days.
Initial download of the metrics may take a while.