Fig. 6.
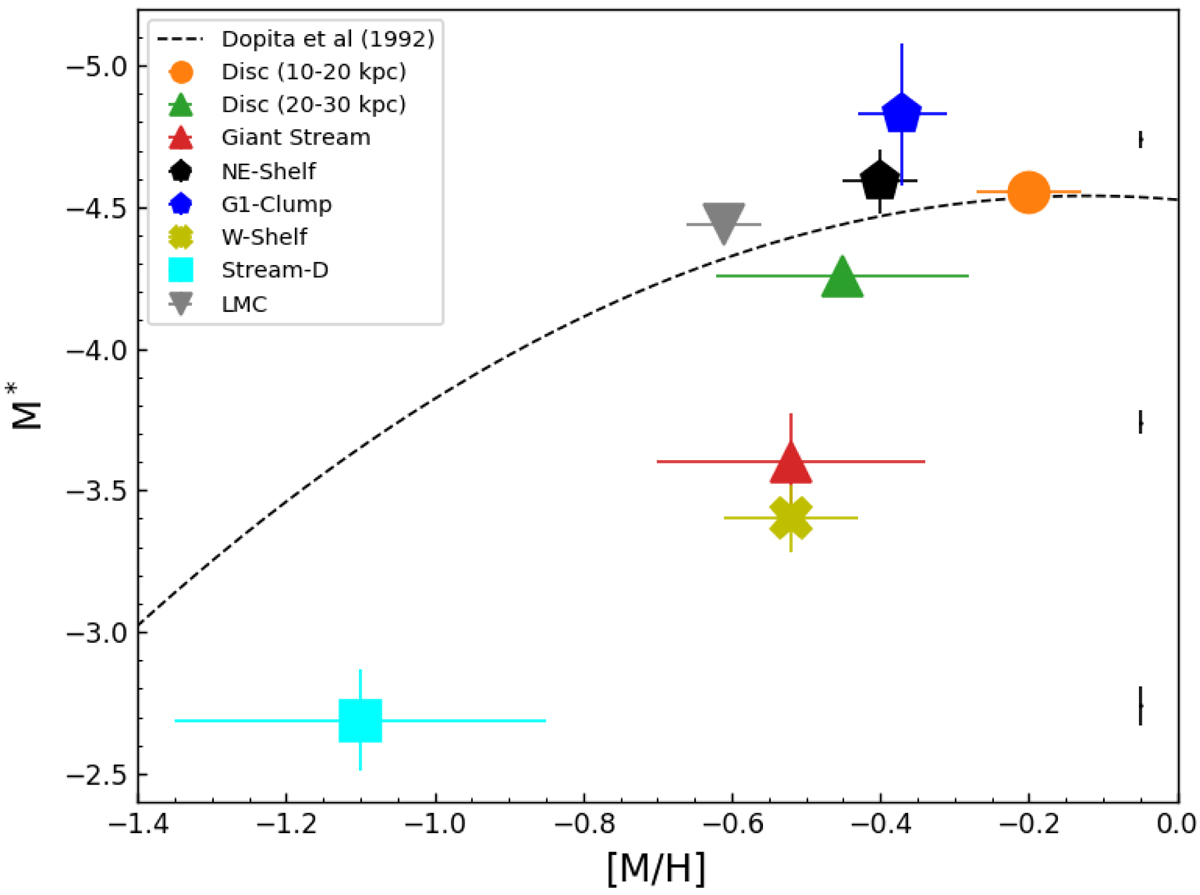
[M/H] for the different regions in M31 is plotted against the M* value obtained from fitting their PNLF. The different markers show the different references for the [M/H] measurements – circle: Williams et al. (2017); pentagon: Bernard et al. (2015); triangle: Escala et al. (2020); inverted triangle: Nidever et al. (2020); cross: Tanaka et al. (2010); square: Conn et al. (2016). The theoretical prediction for the values of M* from Dopita et al. (1992) models is shown with the dotted line. Also shown is the variation of photometric errors in our survey (multiplied by a factor of ten for visual clarity) at the magnitudes corresponding to the given M* values (as black lines at M* = −4.74, −3.74 and −2.74 mag).
Current usage metrics show cumulative count of Article Views (full-text article views including HTML views, PDF and ePub downloads, according to the available data) and Abstracts Views on Vision4Press platform.
Data correspond to usage on the plateform after 2015. The current usage metrics is available 48-96 hours after online publication and is updated daily on week days.
Initial download of the metrics may take a while.