Fig. 5.
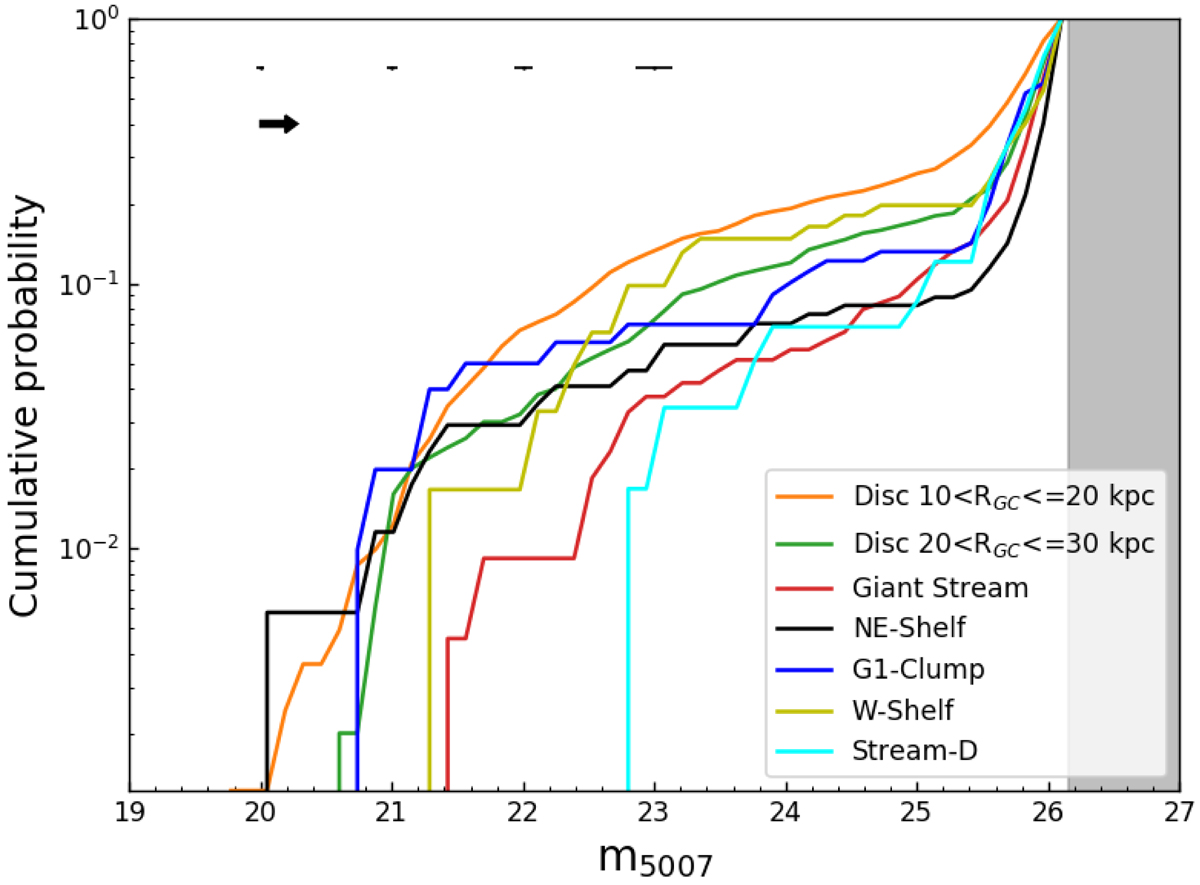
Cumulative probability of the completeness-corrected PNLF is shown (in log scale for visual clarity) for the five different substructures and the two disc regions. This diagnostic plot illustrates in which magnitude ranges the PNLFs are most different. The region fainter than the limiting magnitude of the shallowest field (m5007 > 26.16 mag) is shown in grey. Here, we report the error bars depicting the photometric errors (multiplied by ten for visual clarity) with magnitudes in our survey, shown as black lines at m5007 = 20, 21, 22 and 23 mag respectively. The M* fitted values for each of the PNLFs are robust in the entire survey area given the photometric accuracy (m5007,err ∼ 0.014 mag at m5007 = 23 mag). Furthermore, the arrow in the upper left corner shows the mean photometric extinction within our survey area (A5007 = 0.21 mag).
Current usage metrics show cumulative count of Article Views (full-text article views including HTML views, PDF and ePub downloads, according to the available data) and Abstracts Views on Vision4Press platform.
Data correspond to usage on the plateform after 2015. The current usage metrics is available 48-96 hours after online publication and is updated daily on week days.
Initial download of the metrics may take a while.