Free Access
Fig. 4.
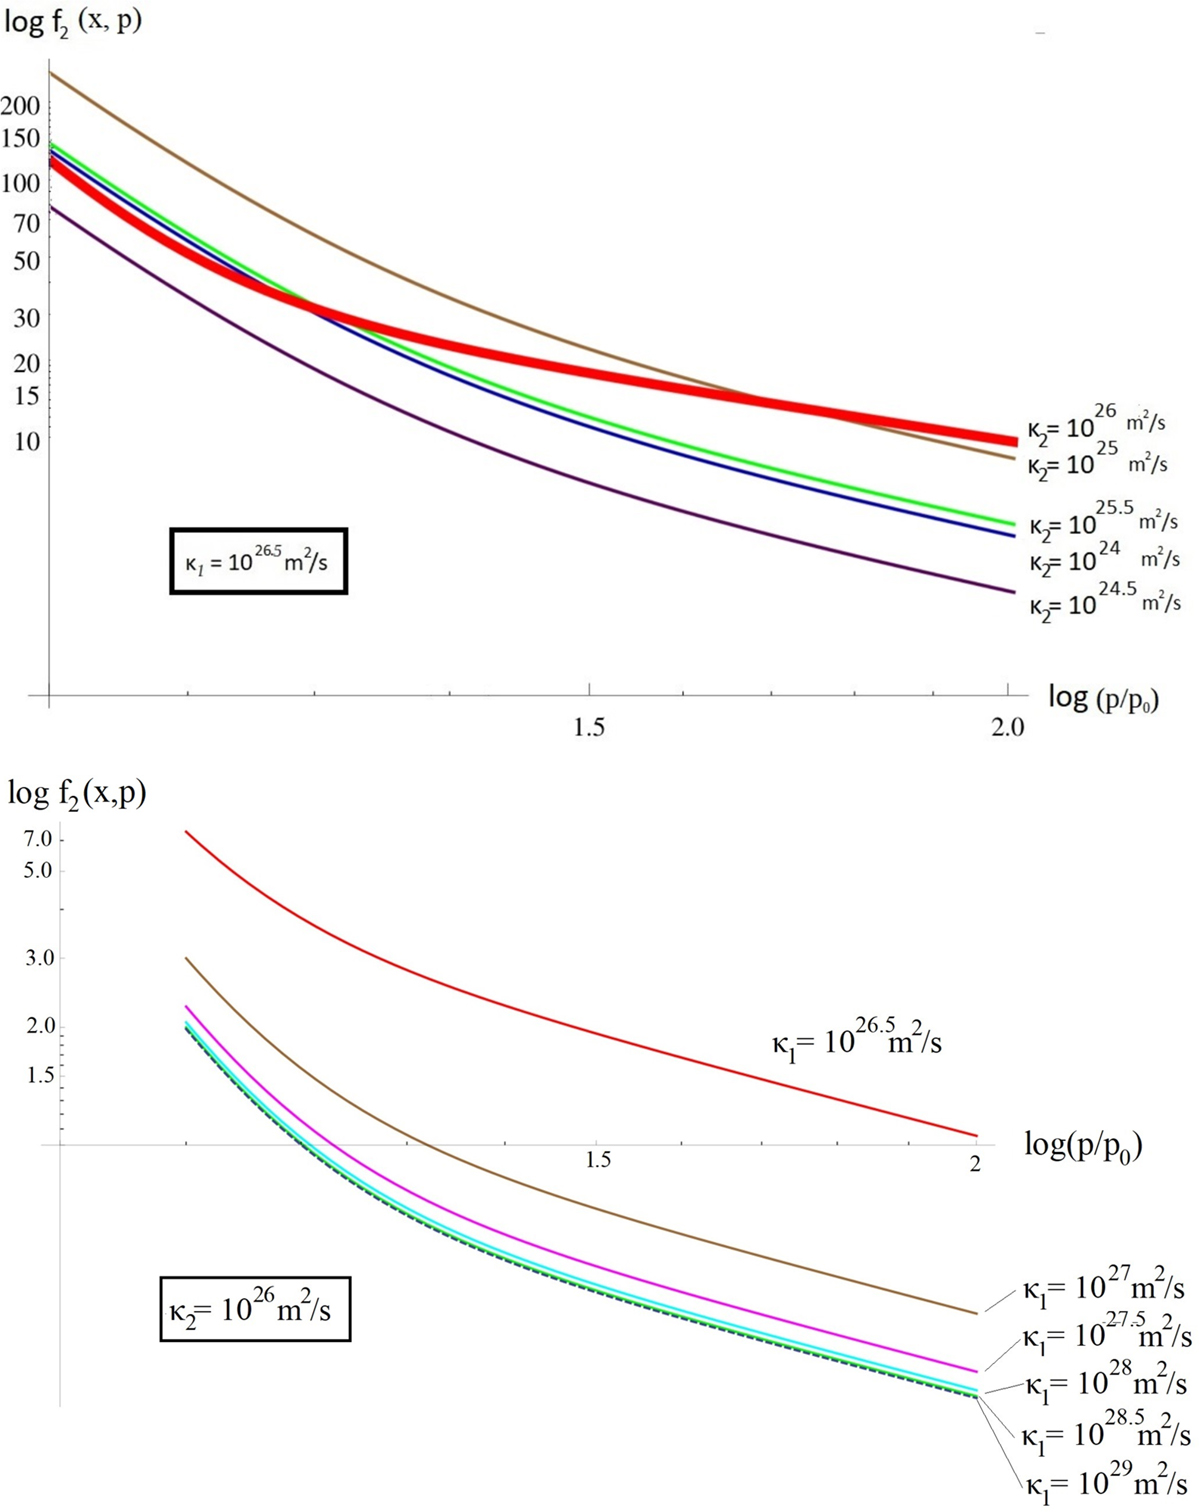
Dependence of the distribution function on the CR momentum for different diffusion coefficients. Top panel: as a function of varying diffusion coefficient of the inter-shock region. Bottom panel: as a function of varying diffusion coefficient of the absolute upstream. We note the dashed (“saturation”) curve.
Current usage metrics show cumulative count of Article Views (full-text article views including HTML views, PDF and ePub downloads, according to the available data) and Abstracts Views on Vision4Press platform.
Data correspond to usage on the plateform after 2015. The current usage metrics is available 48-96 hours after online publication and is updated daily on week days.
Initial download of the metrics may take a while.