Fig. 8.
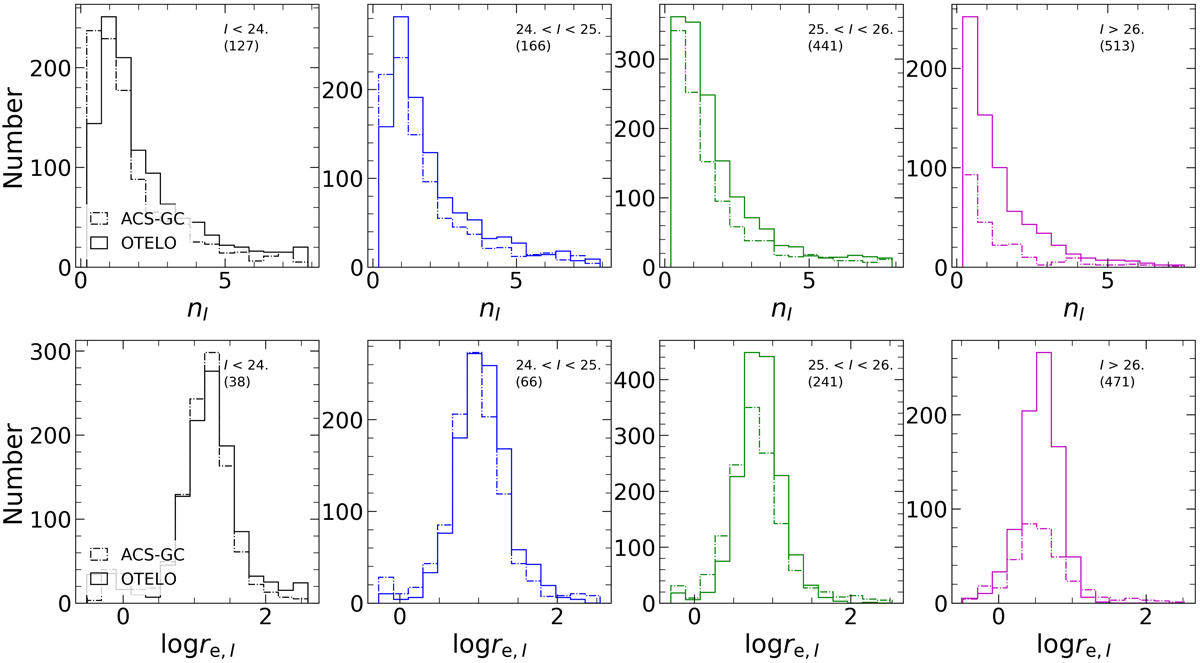
Comparison of the results from this work with those obtained by Griffith et al. (2012). Top row: contains a comparison of the Sérsic index nI distributions, while the bottom row represents the logarithm of effective radius re, I. Each panel show a comparison for each magnitude bin indicated in the top-right corner. Numbers between brackets show the number of sources recovered in this work.
Current usage metrics show cumulative count of Article Views (full-text article views including HTML views, PDF and ePub downloads, according to the available data) and Abstracts Views on Vision4Press platform.
Data correspond to usage on the plateform after 2015. The current usage metrics is available 48-96 hours after online publication and is updated daily on week days.
Initial download of the metrics may take a while.