Fig. 6.
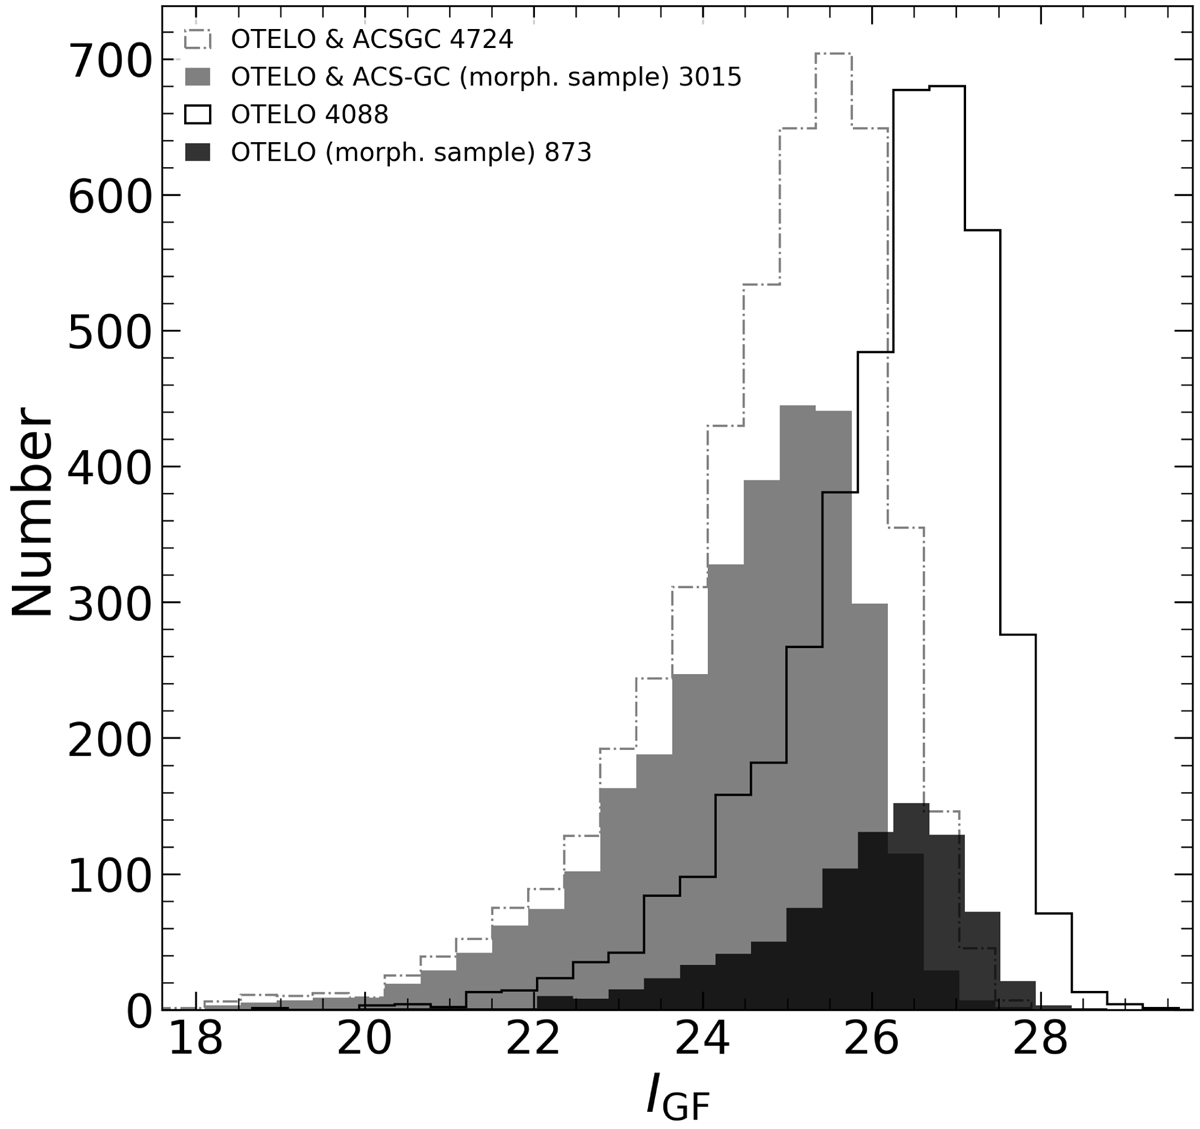
Magnitude comparison with Griffith et al. (2012). Step histogram in gray (dot-dashed line) show common sample, while step histogram (continuous line) show remaining OTELO sources with no matched counterpart from ACS-GC (i.e. only found in OTELO). Filled gray and black histograms correspond to the morphological sample (see Sect. 4.2) from common sample and without counterpart from ACS-GC (i.e. only found in OTELO), respectively. Numbers in the legend indicate the number of sources in the particular sub-sample.
Current usage metrics show cumulative count of Article Views (full-text article views including HTML views, PDF and ePub downloads, according to the available data) and Abstracts Views on Vision4Press platform.
Data correspond to usage on the plateform after 2015. The current usage metrics is available 48-96 hours after online publication and is updated daily on week days.
Initial download of the metrics may take a while.