Fig. 5.
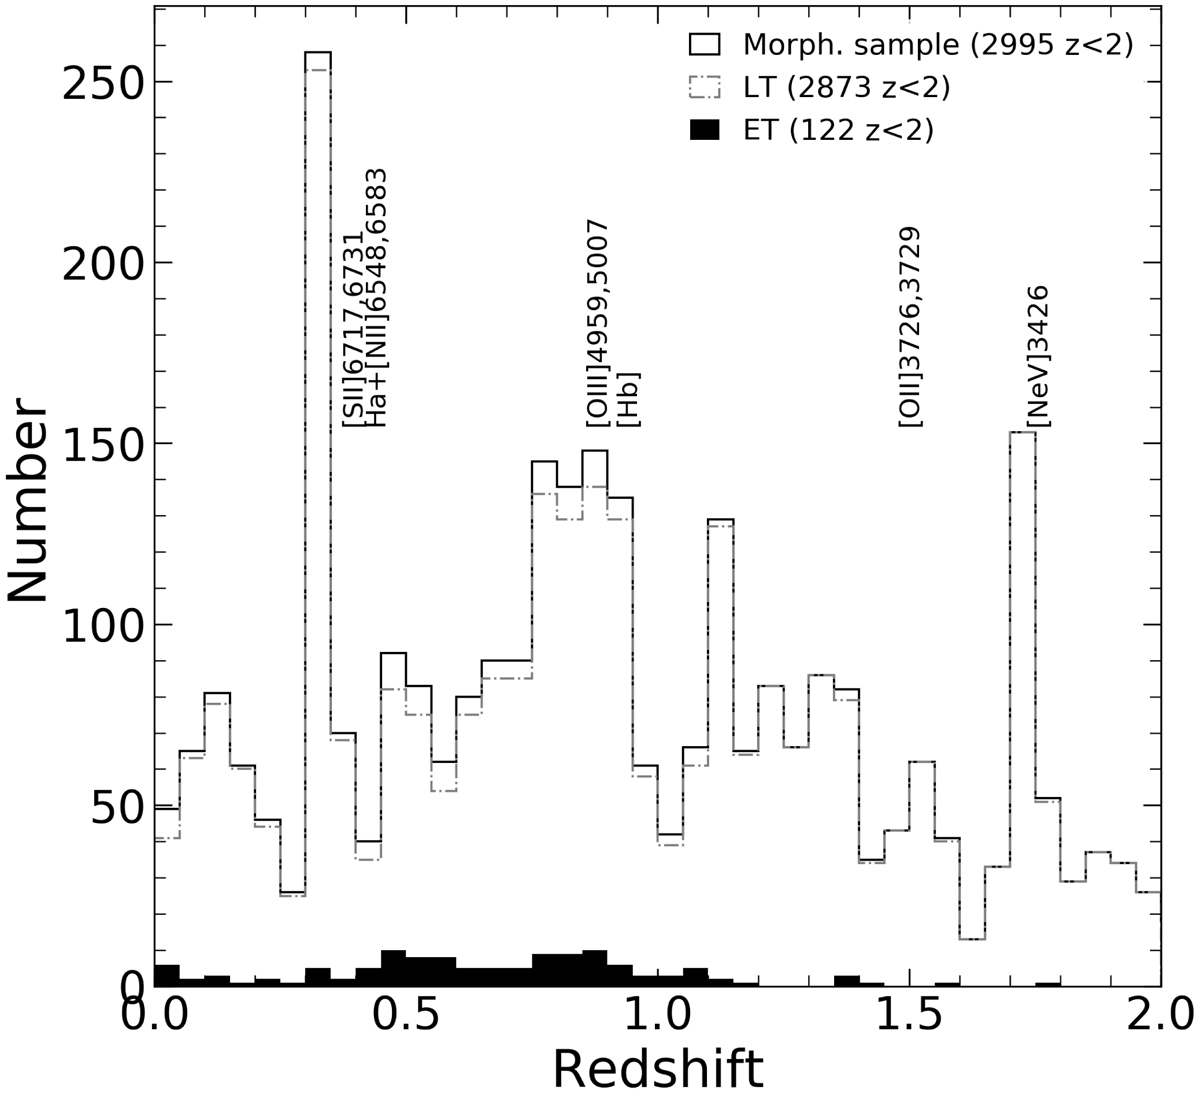
Redshift distribution of the selected morphological sample (see text for details). Peaks in the distribution corresponds to specific emission lines, as seen in OTELO spectra range up to z = 2. Solid black line shows all sources in morphological sample, gray dot-dashed line shows LT galaxies, while black filled histogram shows ET galaxies.
Current usage metrics show cumulative count of Article Views (full-text article views including HTML views, PDF and ePub downloads, according to the available data) and Abstracts Views on Vision4Press platform.
Data correspond to usage on the plateform after 2015. The current usage metrics is available 48-96 hours after online publication and is updated daily on week days.
Initial download of the metrics may take a while.