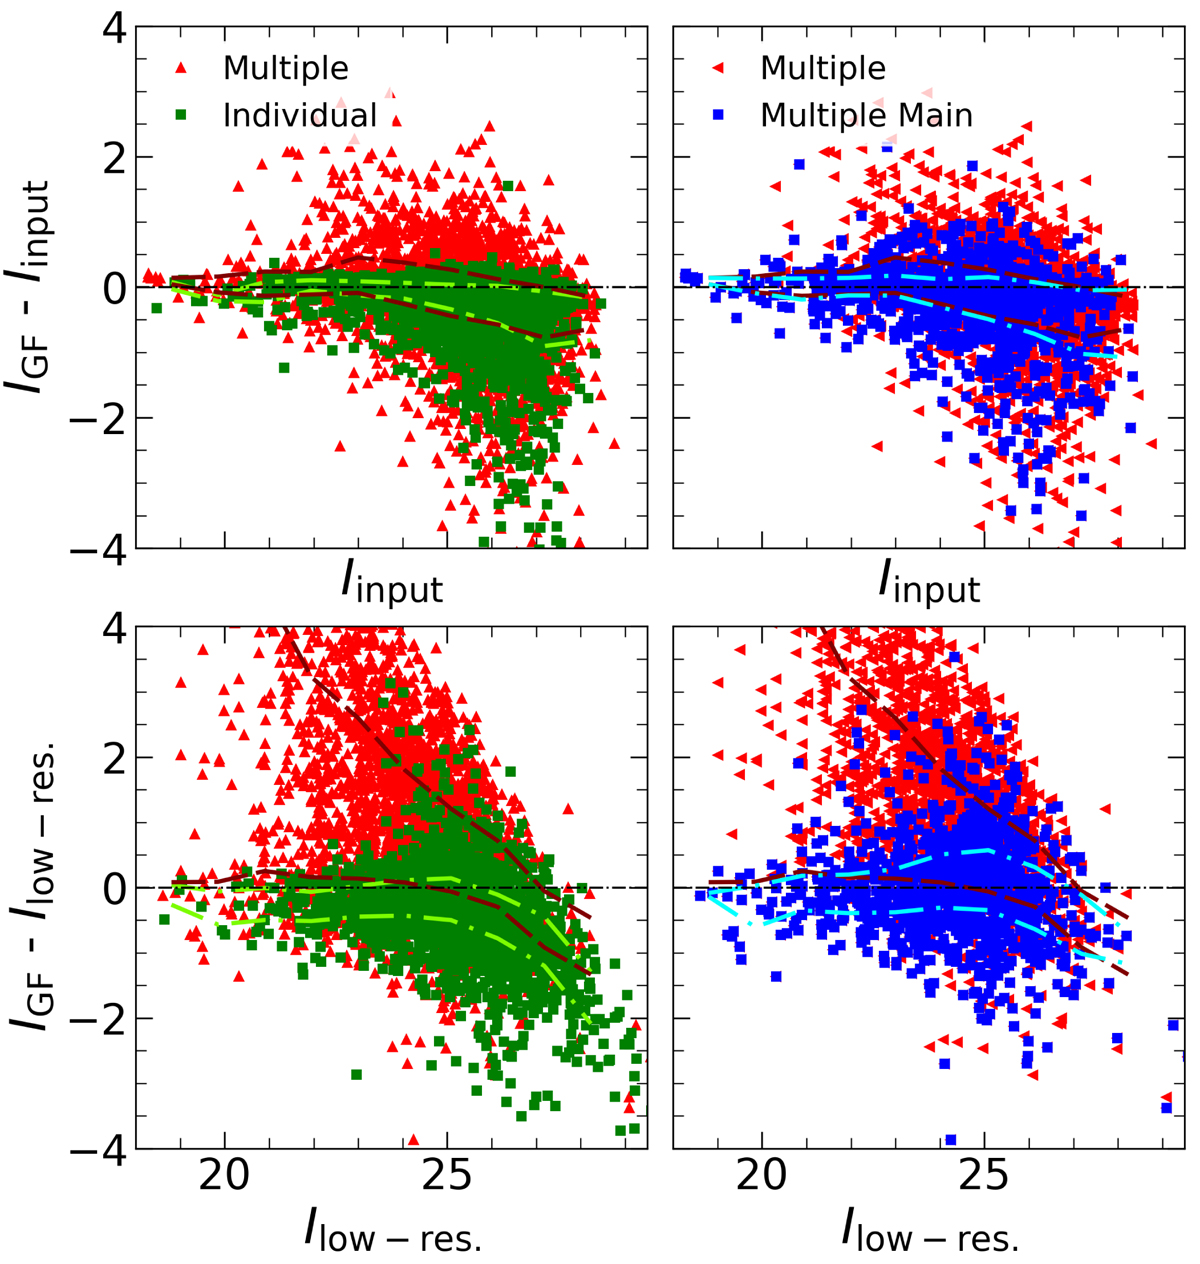
Fig. 4.

Magnitude comparison between low- and high-resolution data. Red up- and left-triangles show multiple sources, green squares show individual sources, while blue squares shows multiple main sources. Top row: comparison of HST-ACS input and GALFIT-M output I-band magnitudes. Bottom row: same comparison as in top row, but instead of input high-resolution photometry we plot low-resolution HST-ACS-F814W photometry from OTELO catalogue. Lines represent the 25th and 75th percentile of the colour distribution per magnitude bin: light green dot-dashed – individual; dark red dashed – multiples; light blue dot-dashed – multiple main. See text for details on the samples selection (Sect. 4).
Current usage metrics show cumulative count of Article Views (full-text article views including HTML views, PDF and ePub downloads, according to the available data) and Abstracts Views on Vision4Press platform.
Data correspond to usage on the plateform after 2015. The current usage metrics is available 48-96 hours after online publication and is updated daily on week days.
Initial download of the metrics may take a while.


