Fig. 3.
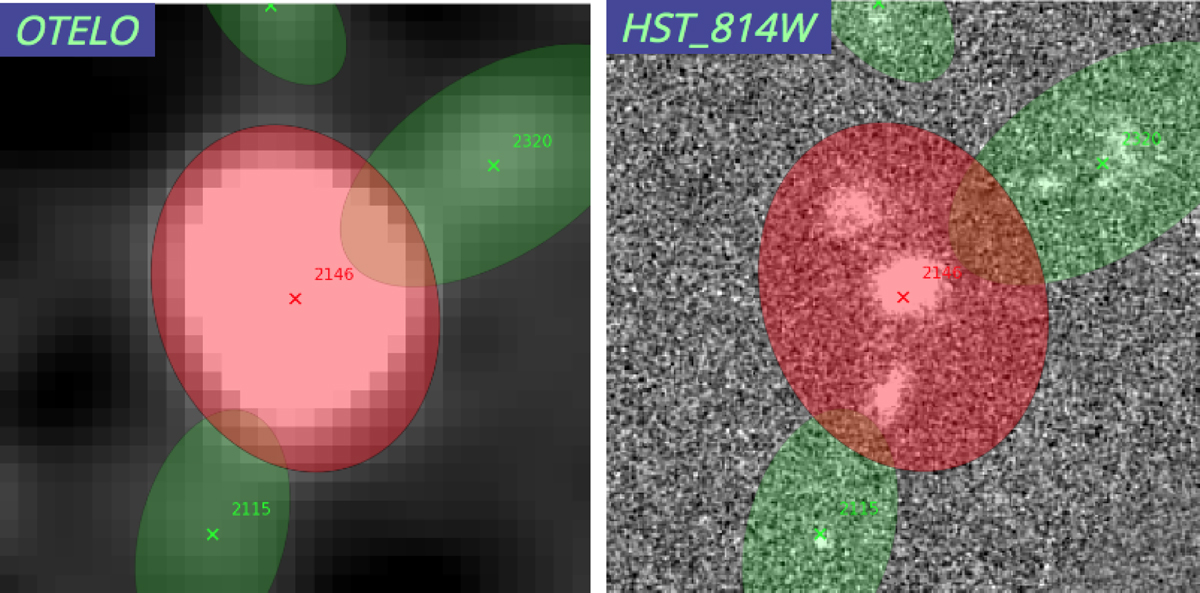
Example of a multiple source with central multiple main objects (these images are available in our web-based graphic user interface). Left: low-resolution OTELOdeep image. Right: HST I-band high-resolution image. Ellipses in red (object in question) and green (neighbouring sources) show Kron ellipses from OTELOdeep image for individual OTELO sources. The red ellipse shows the Kron ellipse corresponding to the source id:2146, inside which two additional sources (or well defined parts of a single galaxy) are visible. This particular source has three matched sources from HST image.
Current usage metrics show cumulative count of Article Views (full-text article views including HTML views, PDF and ePub downloads, according to the available data) and Abstracts Views on Vision4Press platform.
Data correspond to usage on the plateform after 2015. The current usage metrics is available 48-96 hours after online publication and is updated daily on week days.
Initial download of the metrics may take a while.