Fig. 2.
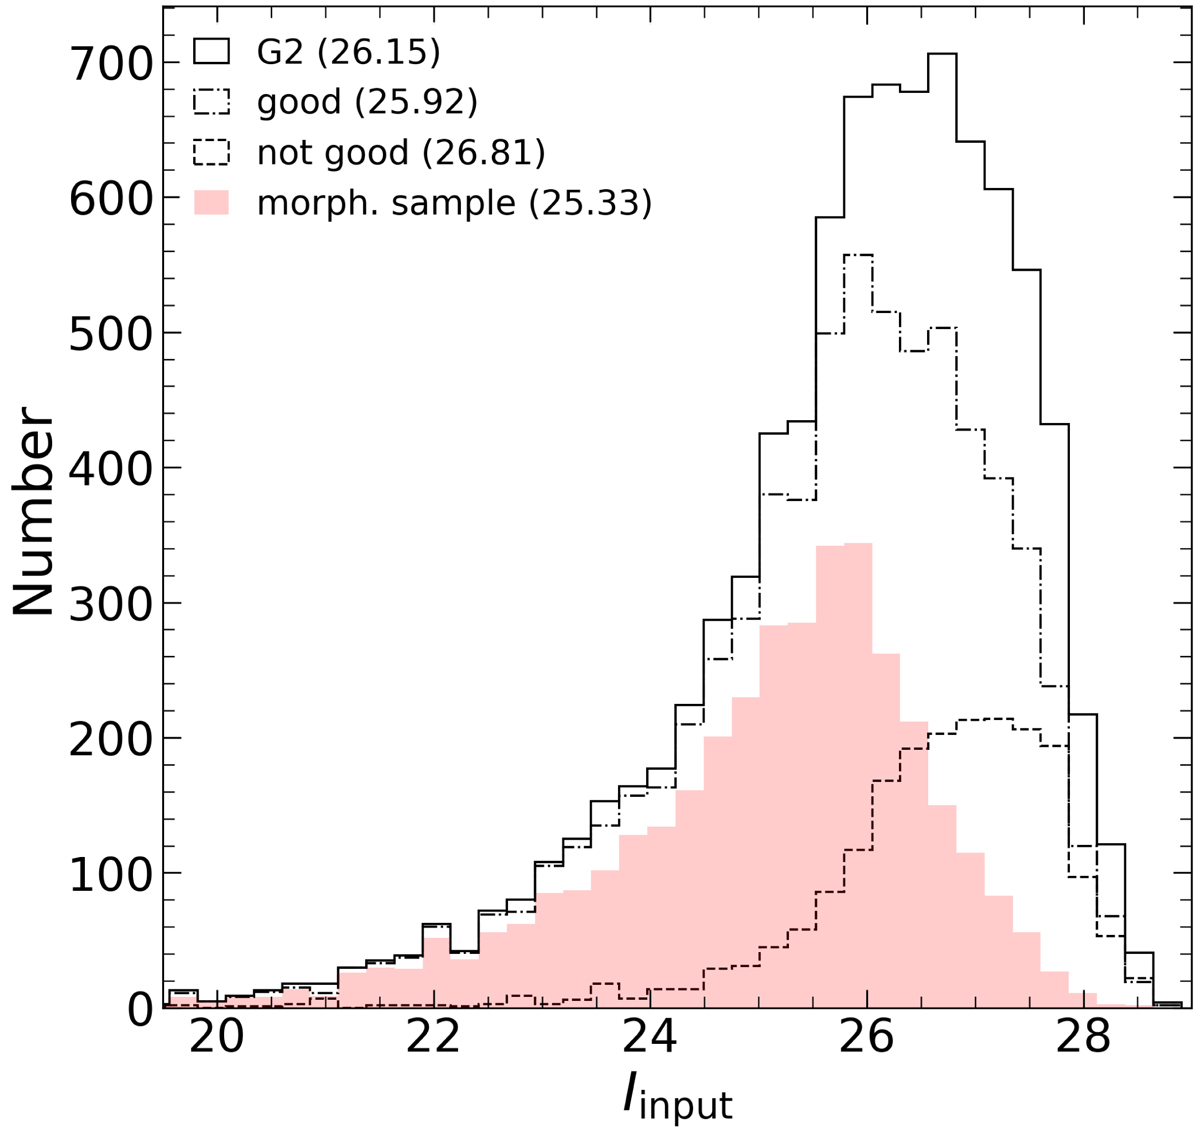
Magnitude completeness. Continuous and dot-dash histograms in black represent the G2 and the ‘good’ samples, respectively. Dashed histogram in black shows the distribution of the sources removed from the G2 sample after the cleaning-out process (see Sect. 4.1). Red histogram shows the distribution of the morphological sample (see Sect. 4.2). Magnitudes indicated in the legend are 50% completeness magnitudes for each sample.
Current usage metrics show cumulative count of Article Views (full-text article views including HTML views, PDF and ePub downloads, according to the available data) and Abstracts Views on Vision4Press platform.
Data correspond to usage on the plateform after 2015. The current usage metrics is available 48-96 hours after online publication and is updated daily on week days.
Initial download of the metrics may take a while.