Fig. 13.
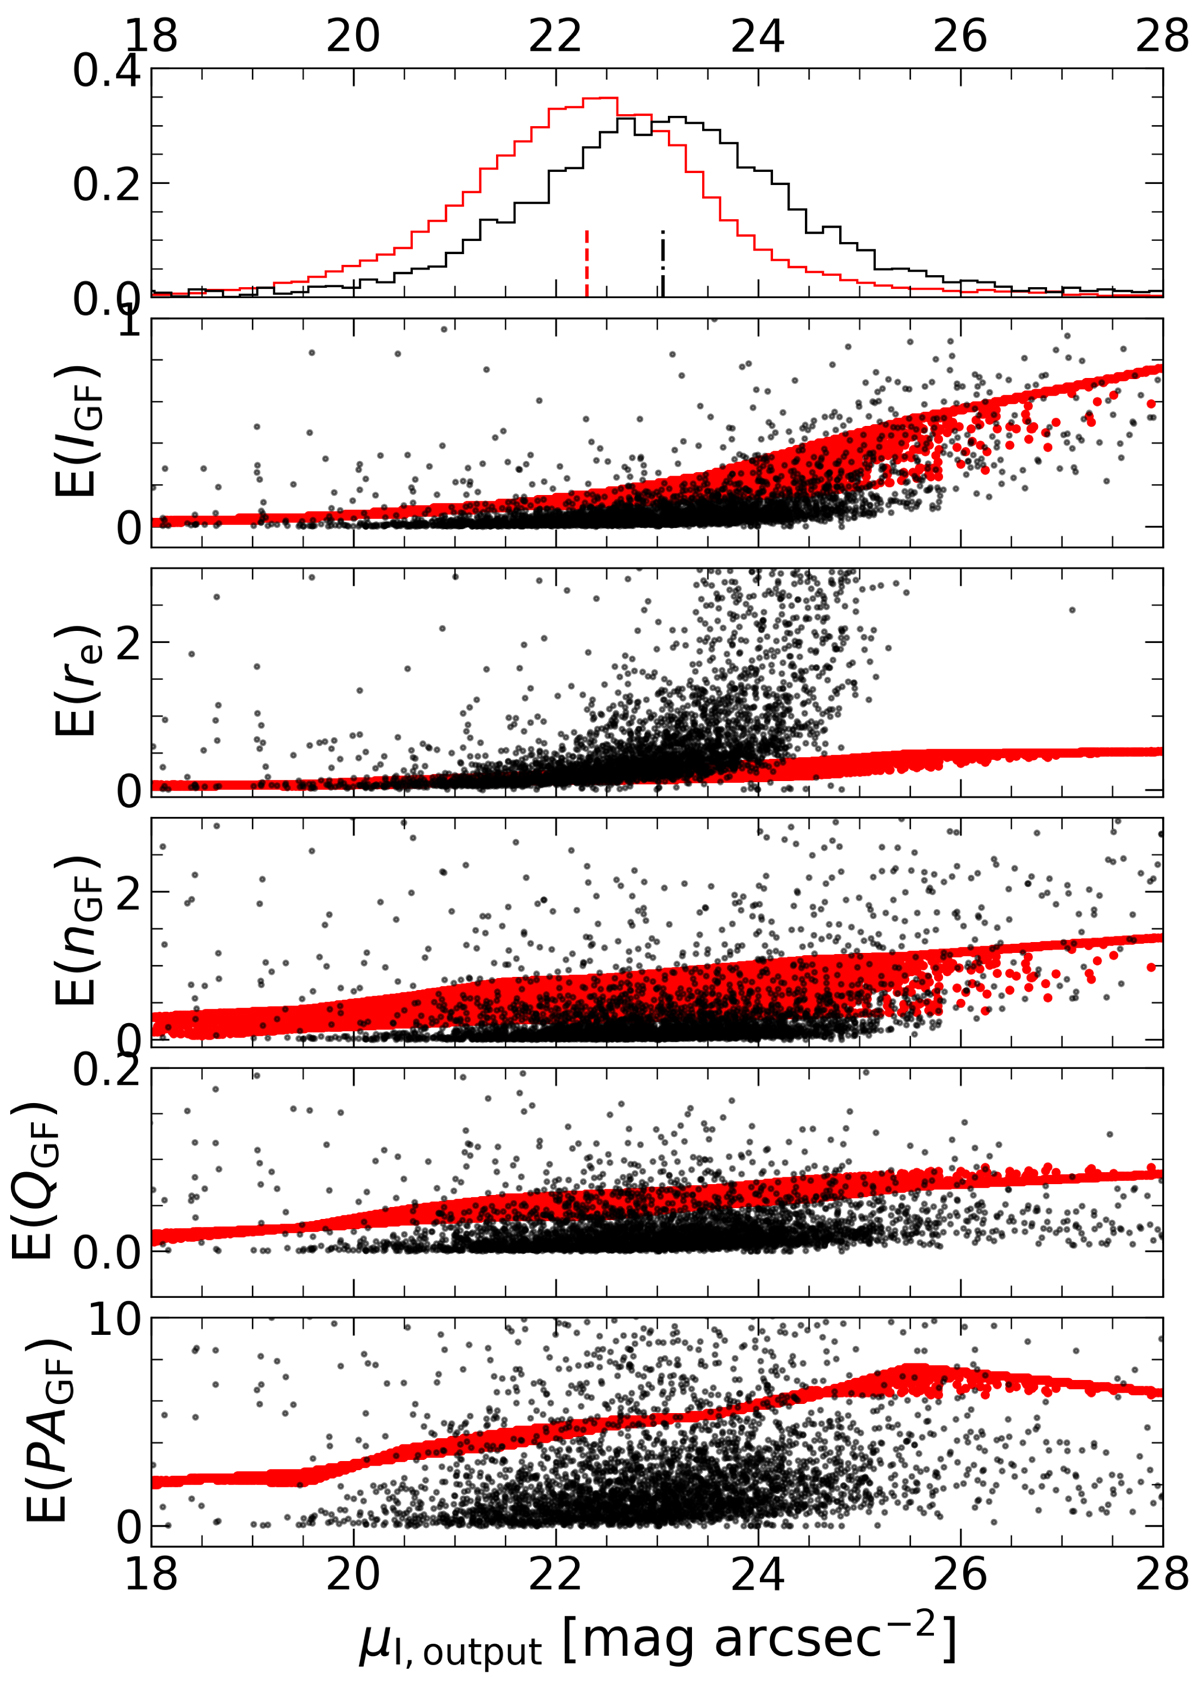
Errors of given parameter as a function of surface brightness μoutput. Black dots show the outcome from this work and the red dots show data for selected (f1 = 1) galaxies from Häussler et al. (2007). Top panels: density distribution of μoutput with median values marked as red dashed-lines (22.3) and black dot-dashed lines (23.04).
Current usage metrics show cumulative count of Article Views (full-text article views including HTML views, PDF and ePub downloads, according to the available data) and Abstracts Views on Vision4Press platform.
Data correspond to usage on the plateform after 2015. The current usage metrics is available 48-96 hours after online publication and is updated daily on week days.
Initial download of the metrics may take a while.