Fig. 11.
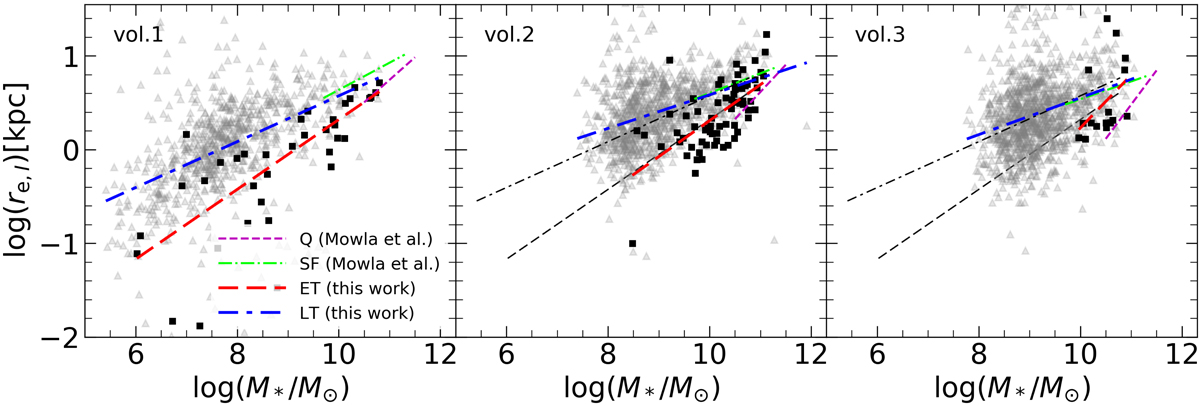
Mass–size relation. Each panel correspond to selected cosmic volumes: z < 0.5, vol2: 0.5 ≤ z < 1, and vol3: 1 ≤ z < 2. Gray triangles and black squares show LT and ET galaxies, respectively. Dot-dashed blue and dashed red lines show power–law fits for LT and ET data, respectively, according to Eq. (2). The best-fit parameters are given in Table 2. Gray dot-dashed, and dashed lines in the middle and right panels show the fits for LT and ET obtained for the first cosmic volume (vol1). Dot-dashed green and dashed magenta lines represent LT (SF) and ET (Q) MSR from Mowla et al. (2019).
Current usage metrics show cumulative count of Article Views (full-text article views including HTML views, PDF and ePub downloads, according to the available data) and Abstracts Views on Vision4Press platform.
Data correspond to usage on the plateform after 2015. The current usage metrics is available 48-96 hours after online publication and is updated daily on week days.
Initial download of the metrics may take a while.