Fig. 3
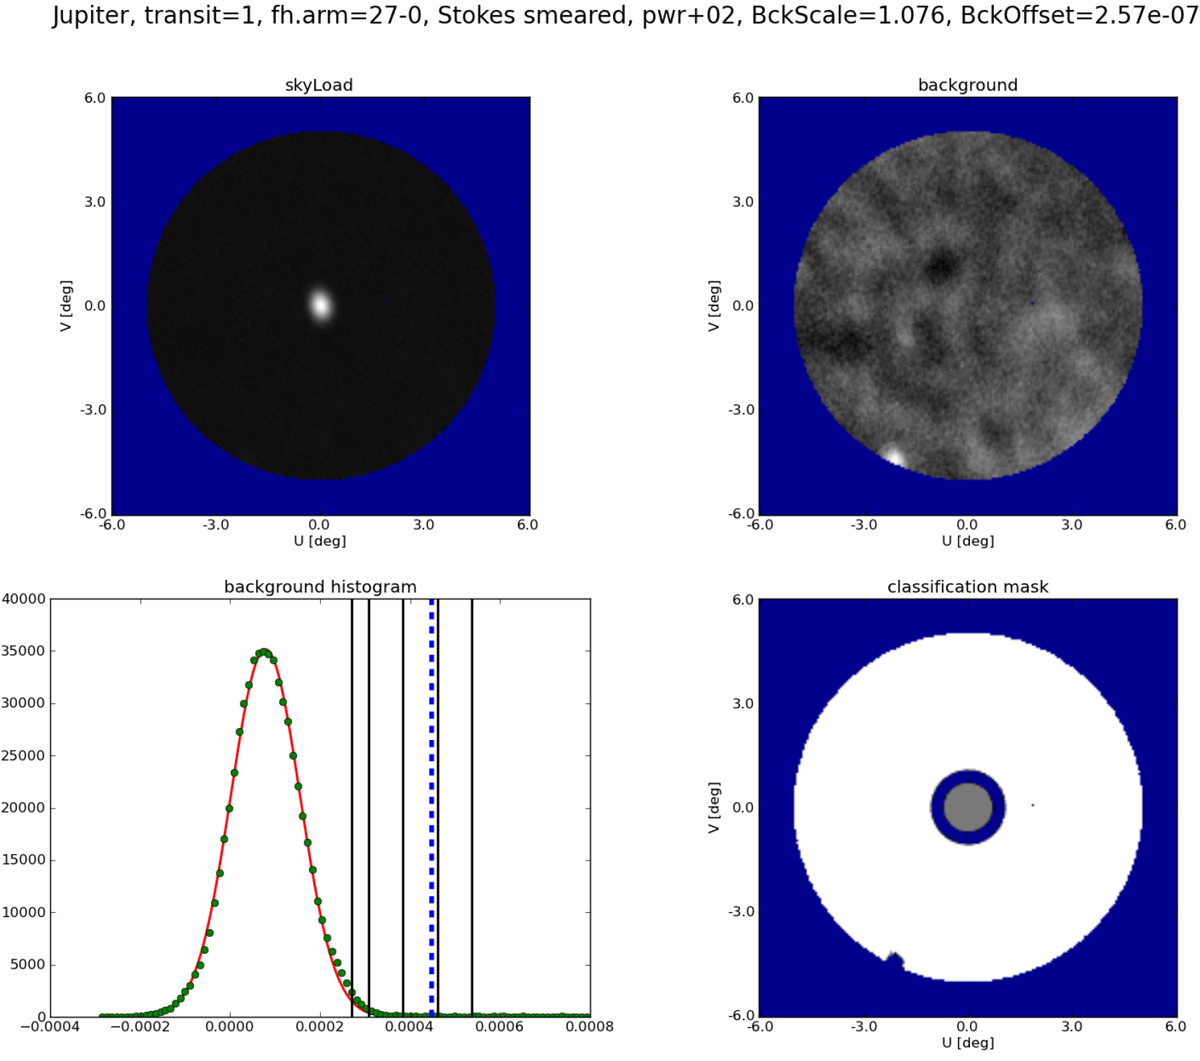
Example of a map in the (u, v) reference frame for Jupiter. This image shows the first transit as seen by radiometer 27–0 (30 GHz). Top left: map of Tant in Kcmb ranging from − 4 × 10⁻⁴ Kcmb to 0.4 Kcmb. Top right: map of the background model, expressed as Tant in Kcmb ranging from − 4 × 10⁻⁴ Kcmb to 1 × 10⁻³ Kcmb. Bottom left: histogram of Tant in Kcmb for the background. The green points indicate the samples in the histogram, the red line indicates the best-fit Gaussian distribution,and the threshold for the classification mask is shown by the dashed blue line. Bottom right: classification mask. The grey region shows the planet ROI, the white annulus is the background ROI, and the blue regions denote unused samples.
Current usage metrics show cumulative count of Article Views (full-text article views including HTML views, PDF and ePub downloads, according to the available data) and Abstracts Views on Vision4Press platform.
Data correspond to usage on the plateform after 2015. The current usage metrics is available 48-96 hours after online publication and is updated daily on week days.
Initial download of the metrics may take a while.