Fig. 10
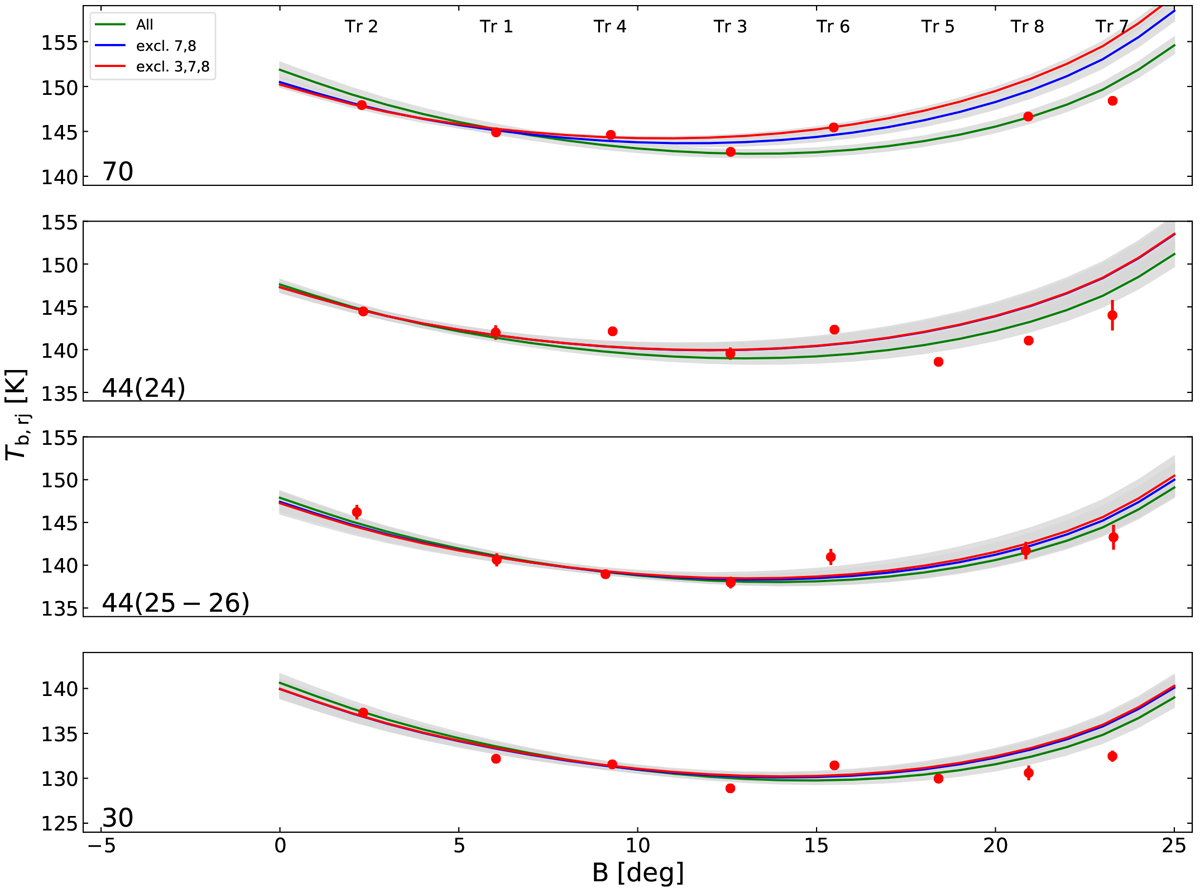
Saturn Tb,rj for 70 GHz frequency channel (first frame from top), 44 GHz frequency channel (second and third frames), and 30 GHz frequency channel (fourth frame) as a function of DP. Labels Tr1, Tr2, …, Tr8 denotes the transit from which each observation originates. Continuous curves refers to the best-fit models of Tb with various selections of data: all transits, transits 7 and 8 excluded, and transits 3, 7, and 8 excluded. The grey bands are 1σ uncertainties in the models.
Current usage metrics show cumulative count of Article Views (full-text article views including HTML views, PDF and ePub downloads, according to the available data) and Abstracts Views on Vision4Press platform.
Data correspond to usage on the plateform after 2015. The current usage metrics is available 48-96 hours after online publication and is updated daily on week days.
Initial download of the metrics may take a while.