Fig. A.3.
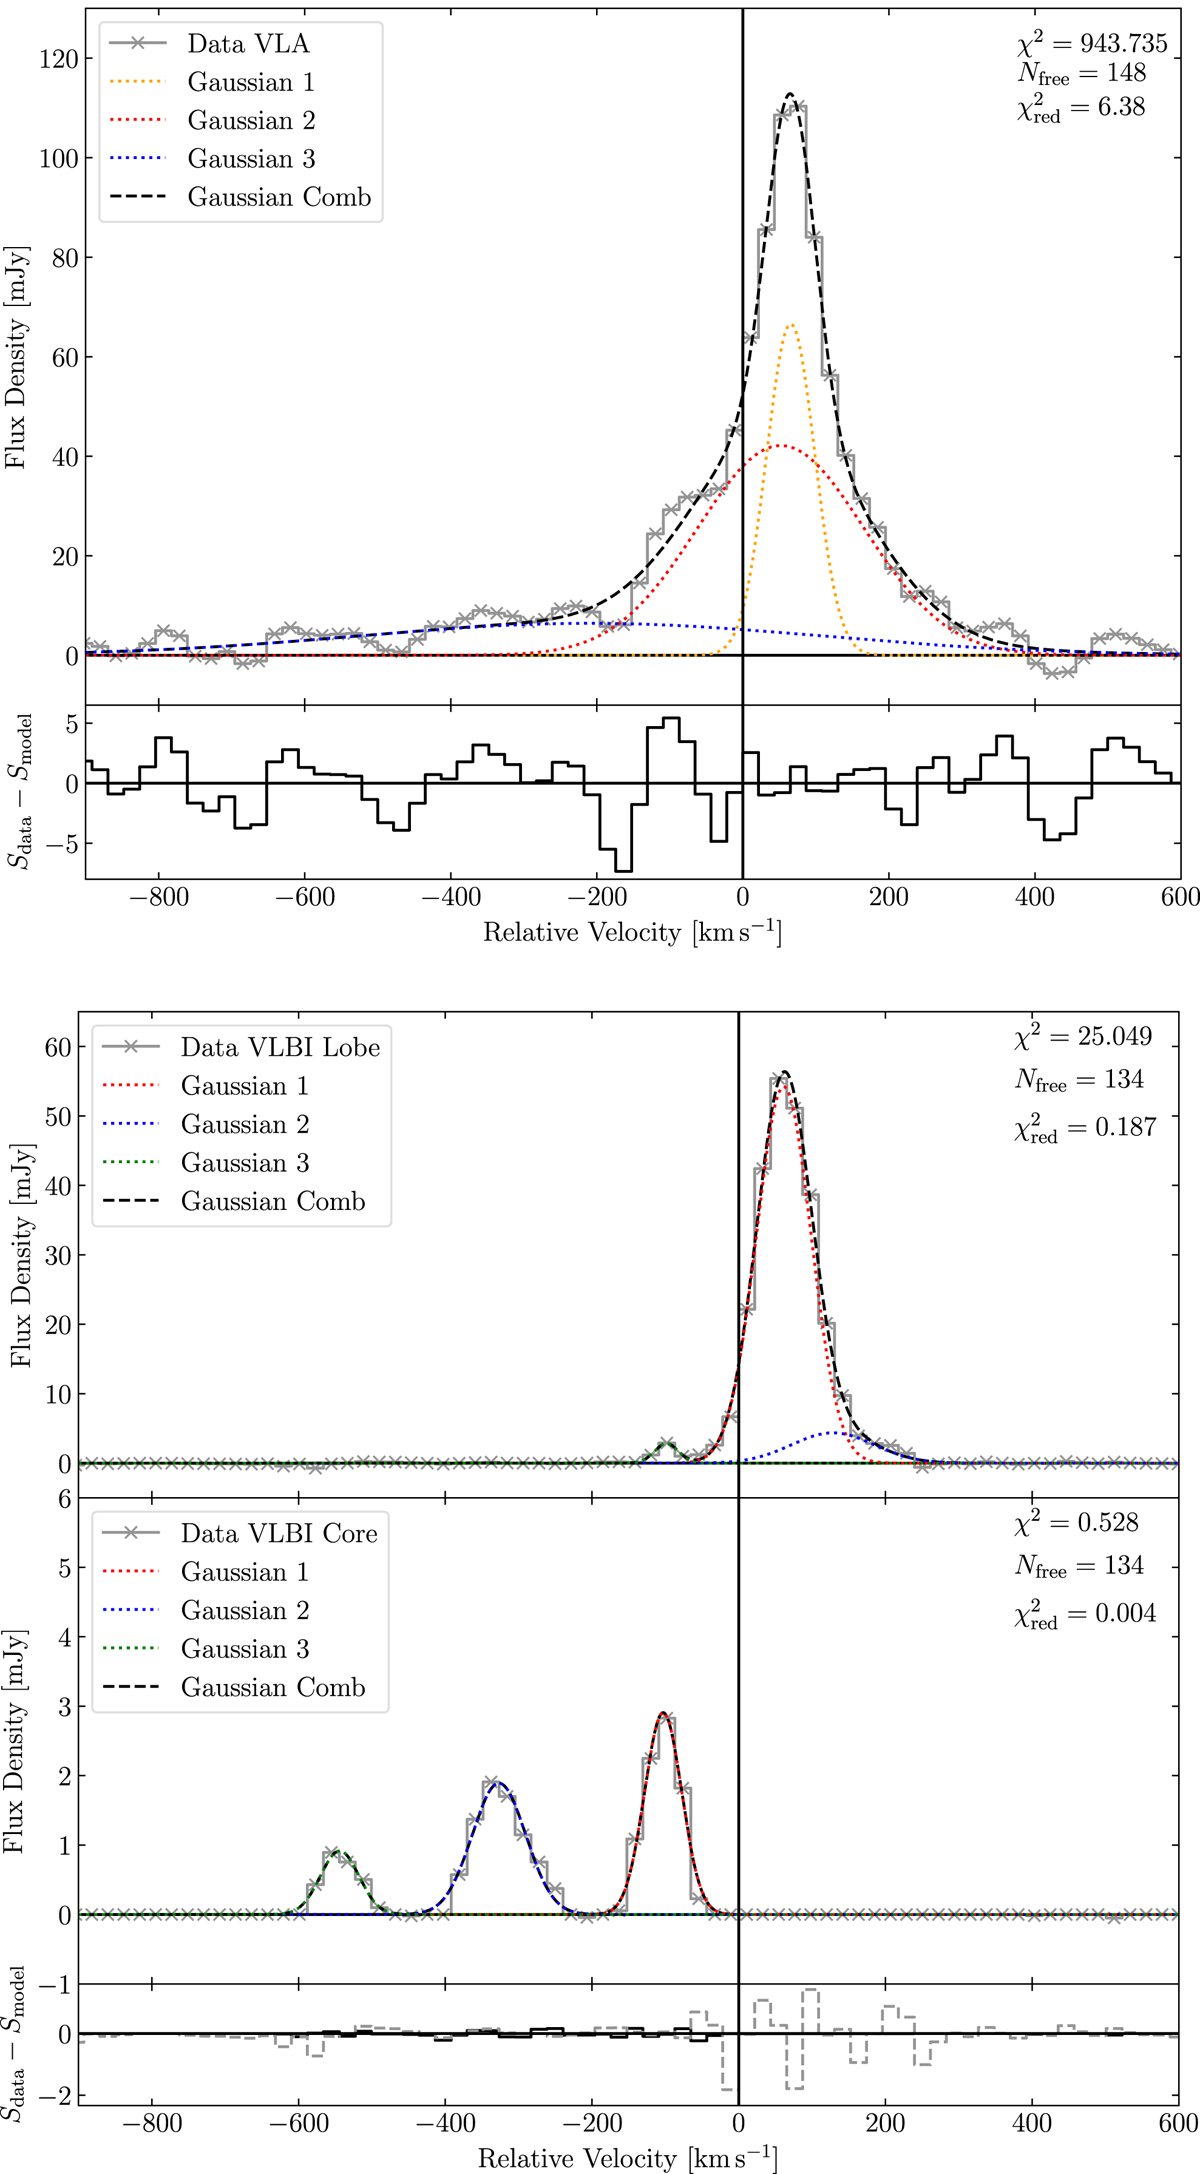
Fits of Gaussian functions to inverted H I absorption spectra of 3C 236. Data are taken from Schulz et al. (2018). Fit parameters are listed in Table A.1. Top: VLA spectrum with three Gaussian components fitted to it (coloured dotted lines). Their combination is shown as the black dashed line. Bottom: clipped integrated VLBI sepctra for the core and lobe region of 3C 236.
Current usage metrics show cumulative count of Article Views (full-text article views including HTML views, PDF and ePub downloads, according to the available data) and Abstracts Views on Vision4Press platform.
Data correspond to usage on the plateform after 2015. The current usage metrics is available 48-96 hours after online publication and is updated daily on week days.
Initial download of the metrics may take a while.