Fig. A.1.
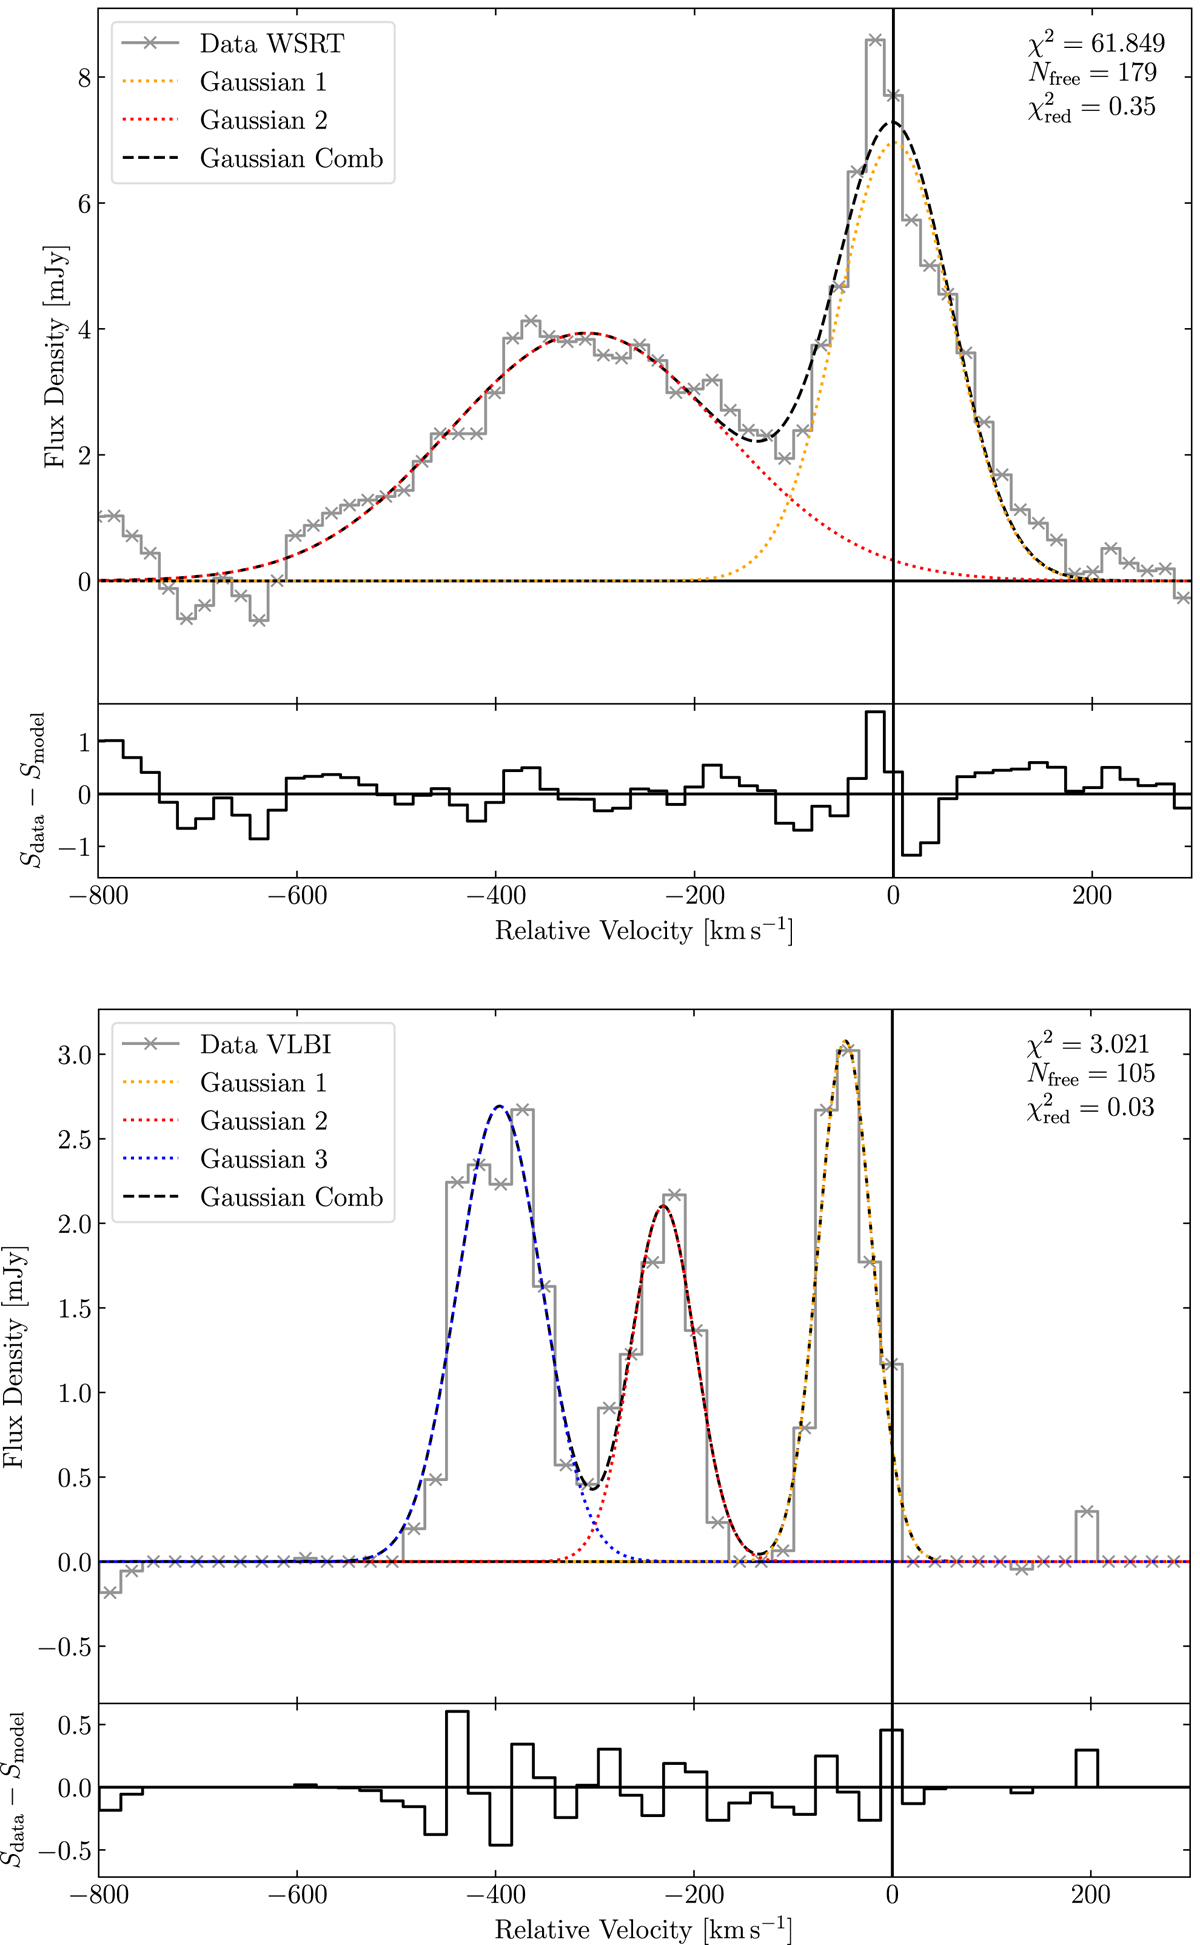
Fits of Gaussian functions to inverted H I absorption spectra of 4C 52.37. The fit paramaters are given in Table A.1. Top: WSRT spectum from Fig. 2 with two Gaussian functions fitted to it (red and yellow dotted lines). The combination of the two fit functions is shown as the black dashed line. The data is colored in gray. Bottom: clipped integrated VLBI spectrum from Fig. 2. Three Gaussian components were fitted to it (colored dotted lines) and their combination is shown as the black dashed line.
Current usage metrics show cumulative count of Article Views (full-text article views including HTML views, PDF and ePub downloads, according to the available data) and Abstracts Views on Vision4Press platform.
Data correspond to usage on the plateform after 2015. The current usage metrics is available 48-96 hours after online publication and is updated daily on week days.
Initial download of the metrics may take a while.