Fig. 5.
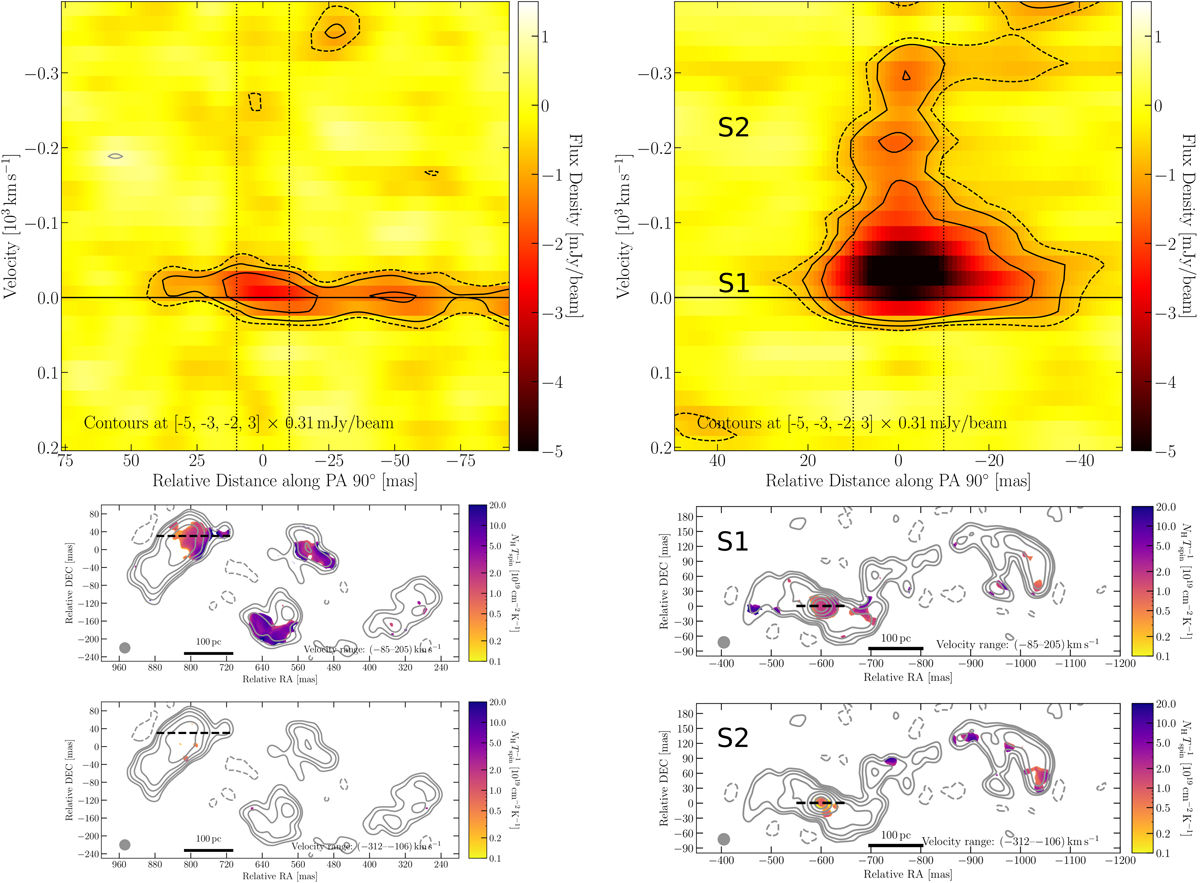
Left panel: position-velocity diagram of a representative location in the eastern part and column density normalized by spin temperature (bottom panel) for the same velocity range as in the right panel. Right panel: position-velocity diagram of 3C 293 at the location of the VLBI core (top panel) and column density normalized by spin temperature separated into systemic and outflowing H I gas (bottom two panels). The dashed lines in the top two panels correspond to the size of the synthesized beam. The dashed lines in the bottom panels correspond to the location of the slice for the position-velocity diagram.
Current usage metrics show cumulative count of Article Views (full-text article views including HTML views, PDF and ePub downloads, according to the available data) and Abstracts Views on Vision4Press platform.
Data correspond to usage on the plateform after 2015. The current usage metrics is available 48-96 hours after online publication and is updated daily on week days.
Initial download of the metrics may take a while.