Fig. 4.
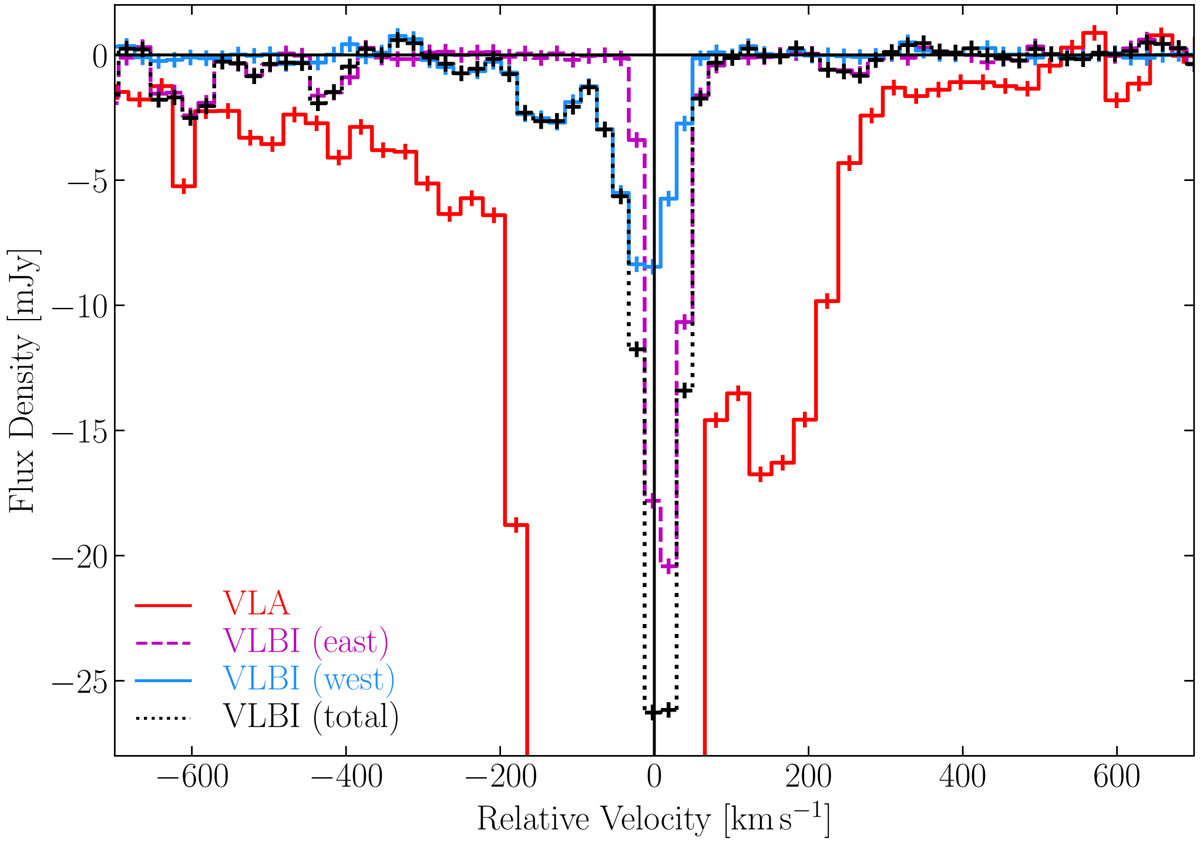
H I absorption spectra of 3C 293. The low-resolution VLA spectrum is shown in red. The solid blue and dashed violet lines correspond to the spatially integrated VLBI spectra of the eastern and western part of the source. The dotted, gray line represents the total integrated VLBI spectrum. The VLBI spectra were obtained by only integrating pixels with a value of ≤ − 3σVLBI, cube.
Current usage metrics show cumulative count of Article Views (full-text article views including HTML views, PDF and ePub downloads, according to the available data) and Abstracts Views on Vision4Press platform.
Data correspond to usage on the plateform after 2015. The current usage metrics is available 48-96 hours after online publication and is updated daily on week days.
Initial download of the metrics may take a while.