Fig. 3.
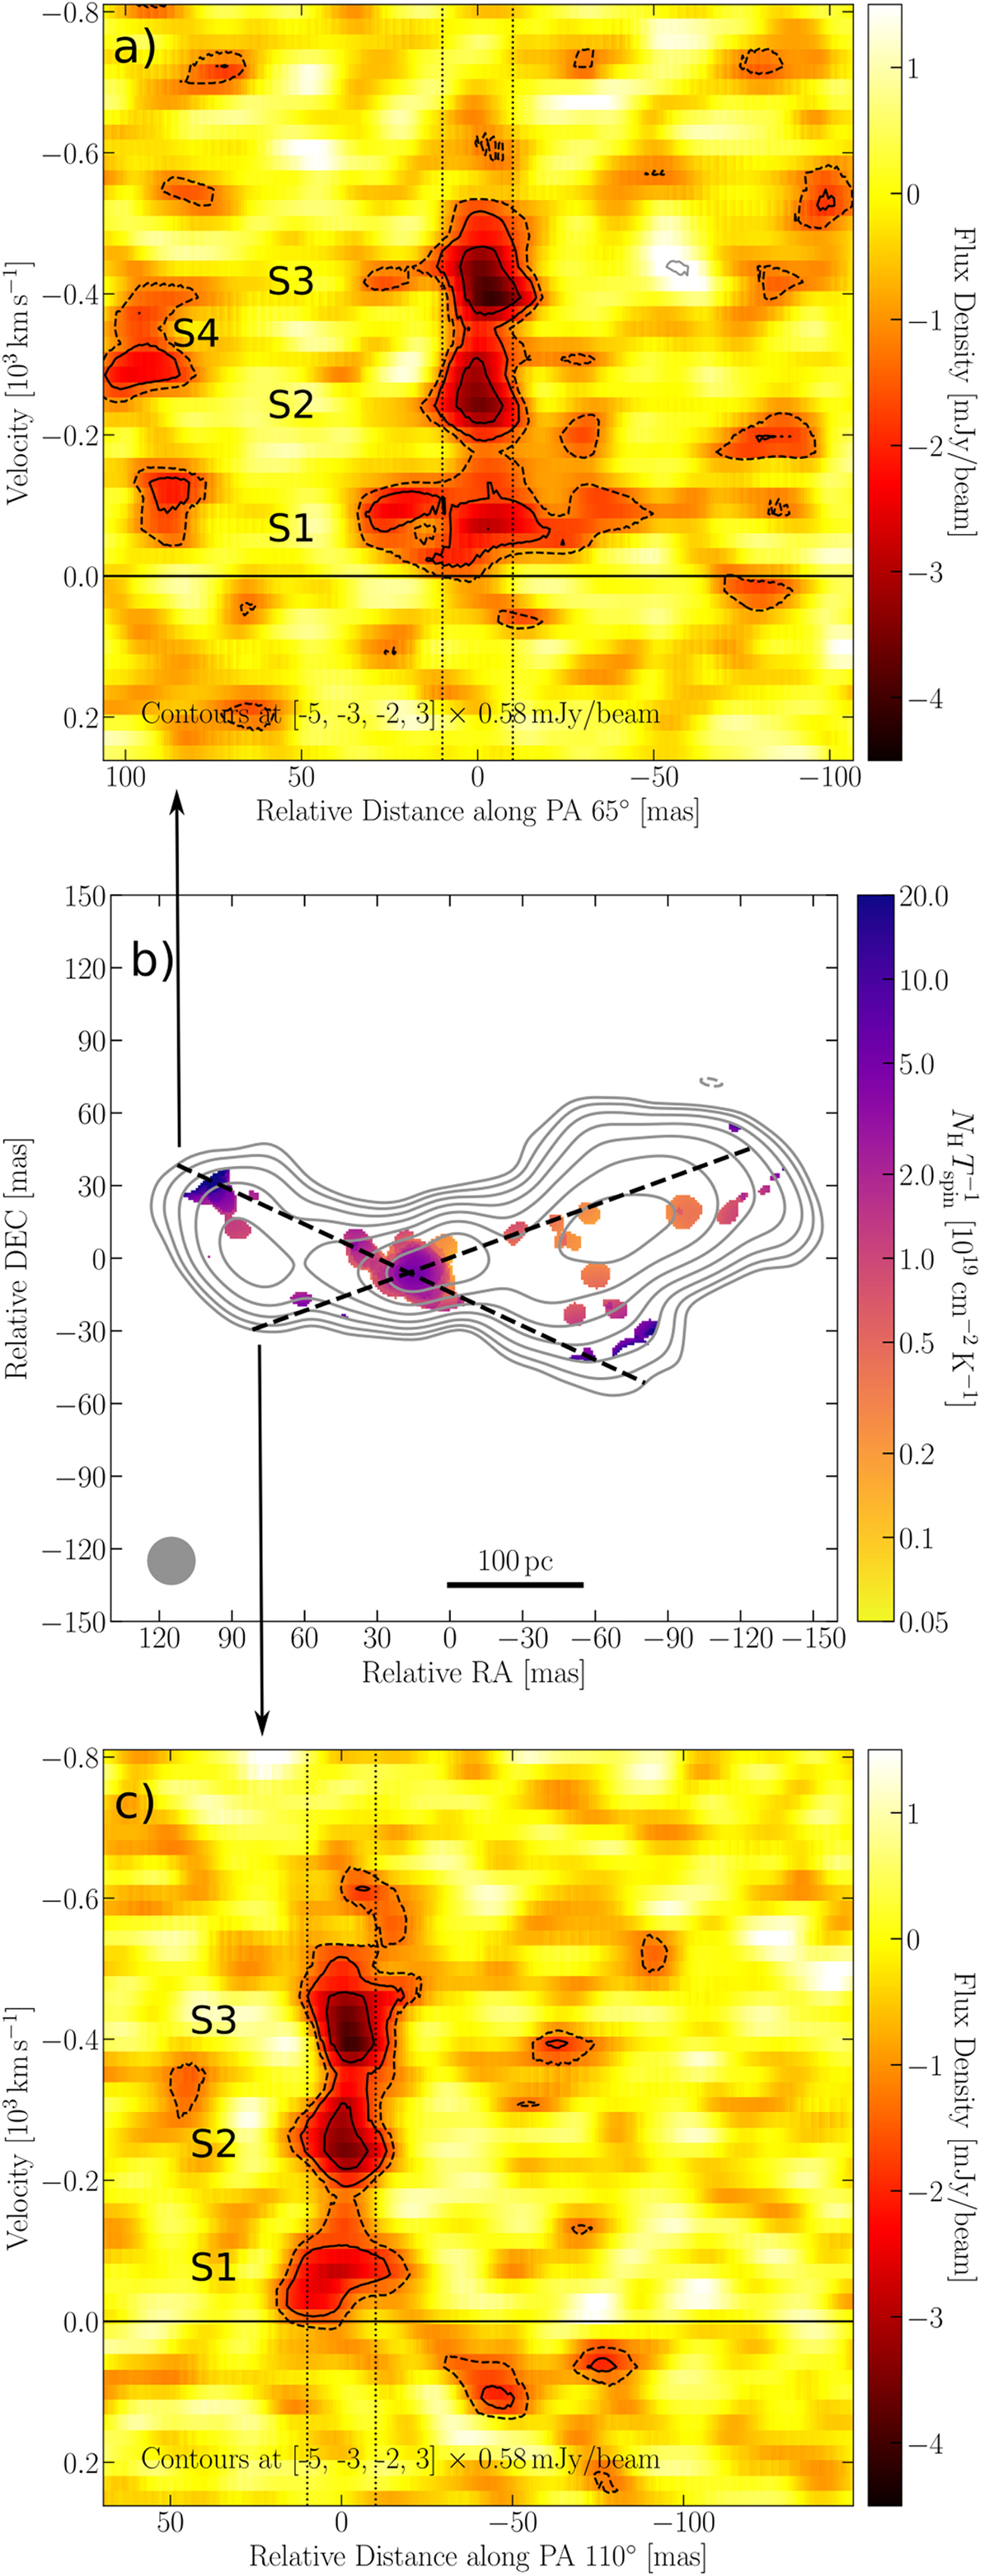
Top panel: position-velocity (PV) diagram of 4C 52.37 along a cut aligned with the largest extent of the central absorption feature. The solid, horizontal line corresponds to the systemic velocity. The dashed, vertical lines mark the size of the synthesized beam. Contour lines correspond to 3 (grey, solid), −2 (black, dashed), −3, and −5 (black, solid) times the noise level in the cube. Middle panel: contour lines show the continuum radio emission as in Fig. 1 with the color map corresponding to ![]() . The dashed lines represent the cuts for the PV diagram. Bottom panel: same as top panel, but a cut along the position angle of W1 and E1. The top and bottom panels are centred on E1.
. The dashed lines represent the cuts for the PV diagram. Bottom panel: same as top panel, but a cut along the position angle of W1 and E1. The top and bottom panels are centred on E1.
Current usage metrics show cumulative count of Article Views (full-text article views including HTML views, PDF and ePub downloads, according to the available data) and Abstracts Views on Vision4Press platform.
Data correspond to usage on the plateform after 2015. The current usage metrics is available 48-96 hours after online publication and is updated daily on week days.
Initial download of the metrics may take a while.