Fig. 2.
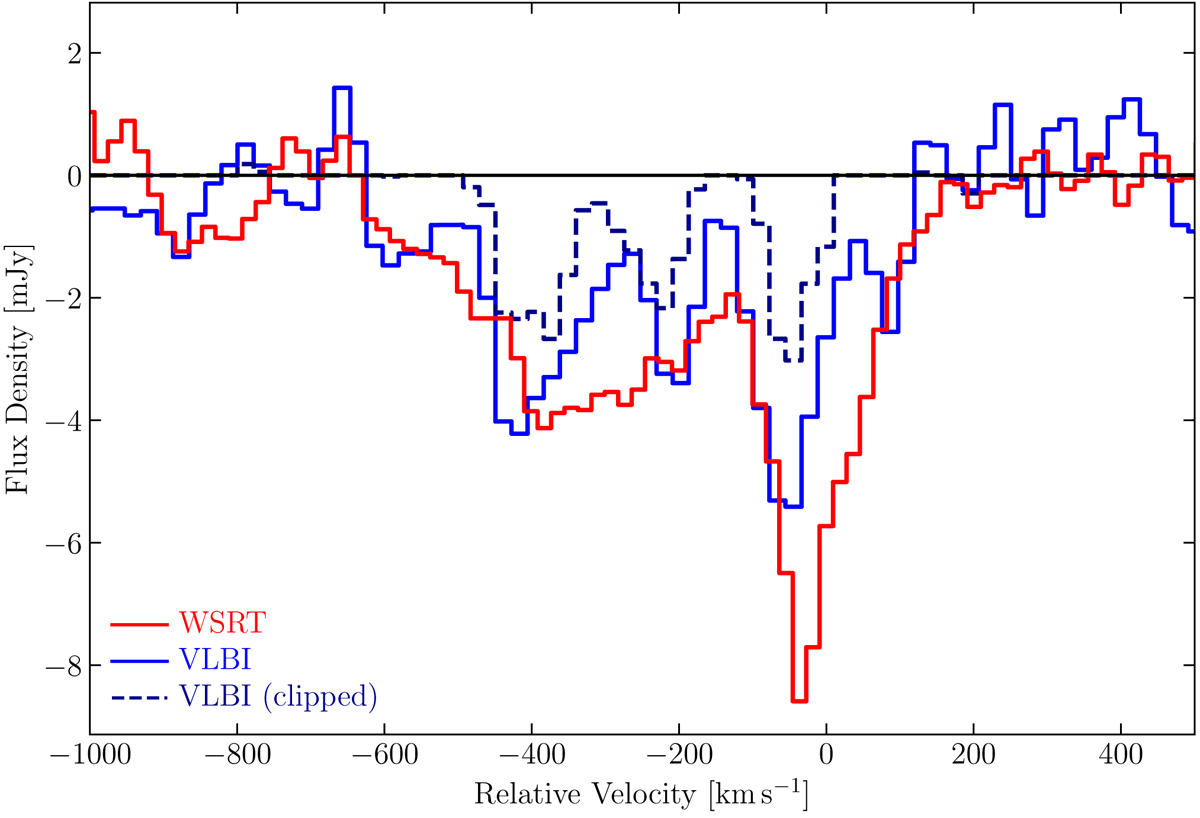
H I absorption spectra of 4C 52.37. The unresolved WSRT spectrum is shown in red. The two spatially integrated VLBI profiles (in blue) were extracted from a region of 60 mas × 40 mas centered on E1. The dashed blue line corresponds to the VLBI spectrum that was obtained by integrating only pixels with a value of ≤ − 3σVLBI, cube, while for the solid blue line the integration was only limited to the region marked by the 3σVLBI, cont contour.
Current usage metrics show cumulative count of Article Views (full-text article views including HTML views, PDF and ePub downloads, according to the available data) and Abstracts Views on Vision4Press platform.
Data correspond to usage on the plateform after 2015. The current usage metrics is available 48-96 hours after online publication and is updated daily on week days.
Initial download of the metrics may take a while.