Fig. 1.
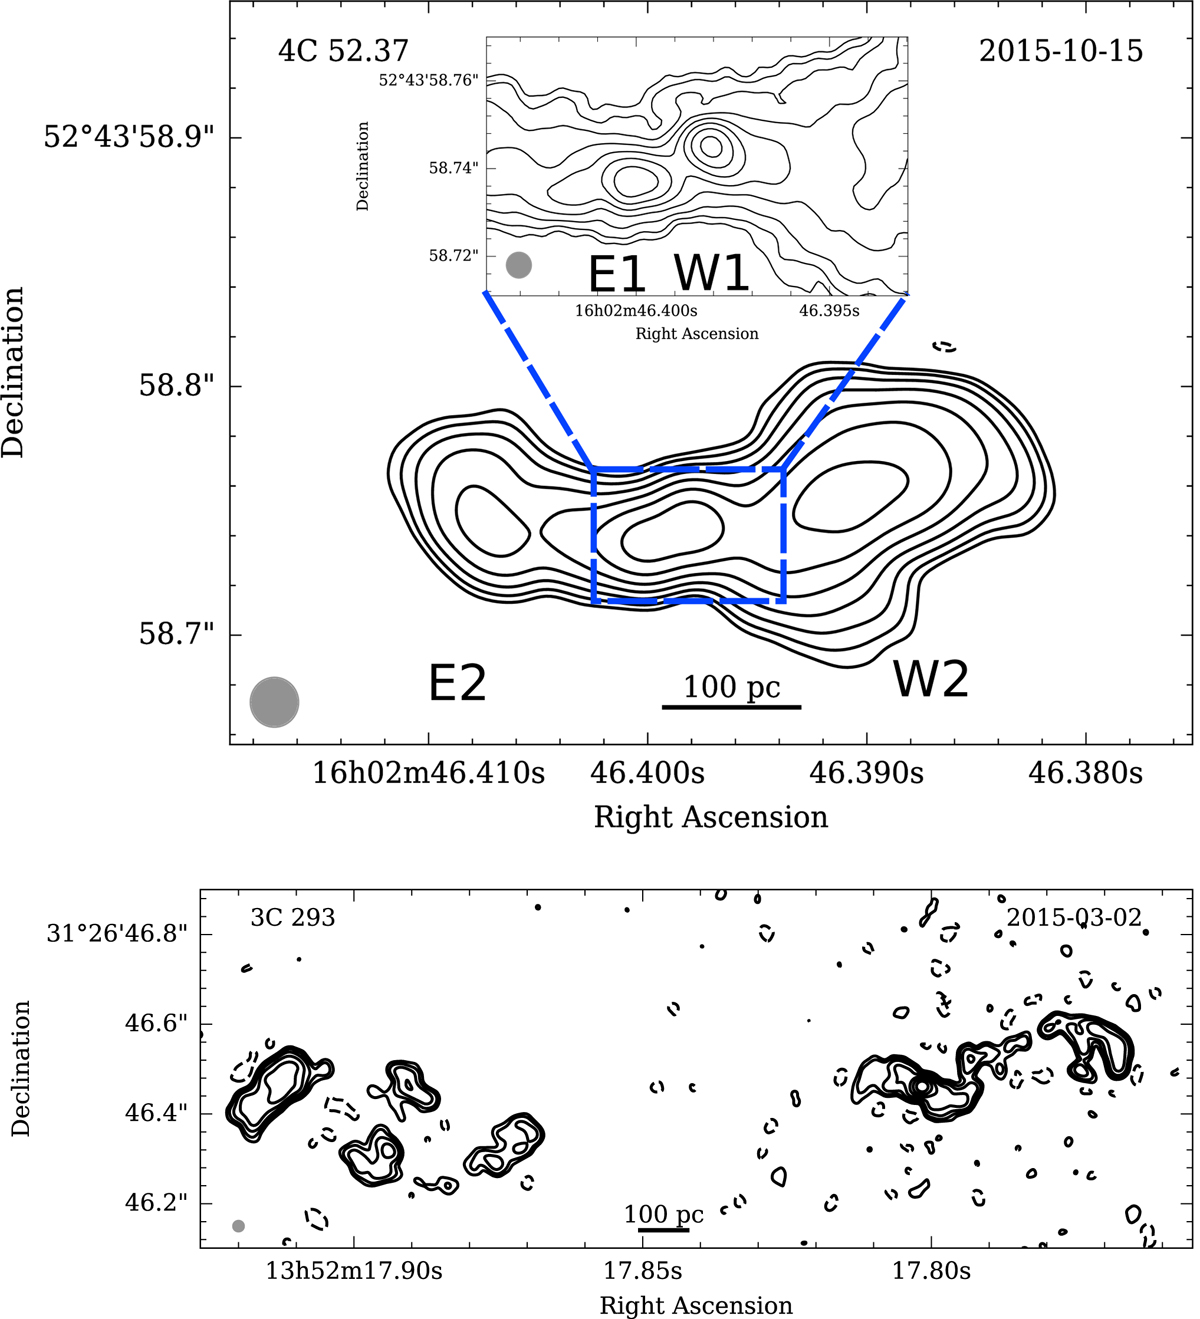
Continuum images of 4C 52.37 (top) and 3C 293 (bottom) convolved with a synthesized beam of 20 mas and 25 mas, respectively, which is marked by the gray circle. The top panel also shows a higher resolution (6 mas) zoom-in of the central region of the radio source. The contour lines begin at three times the noise level of the corresponding image and increase logarithmically by a factor of 2. The solid, horizontal scale bar represents the spatial scales.
Current usage metrics show cumulative count of Article Views (full-text article views including HTML views, PDF and ePub downloads, according to the available data) and Abstracts Views on Vision4Press platform.
Data correspond to usage on the plateform after 2015. The current usage metrics is available 48-96 hours after online publication and is updated daily on week days.
Initial download of the metrics may take a while.