Free Access
Fig. 5.
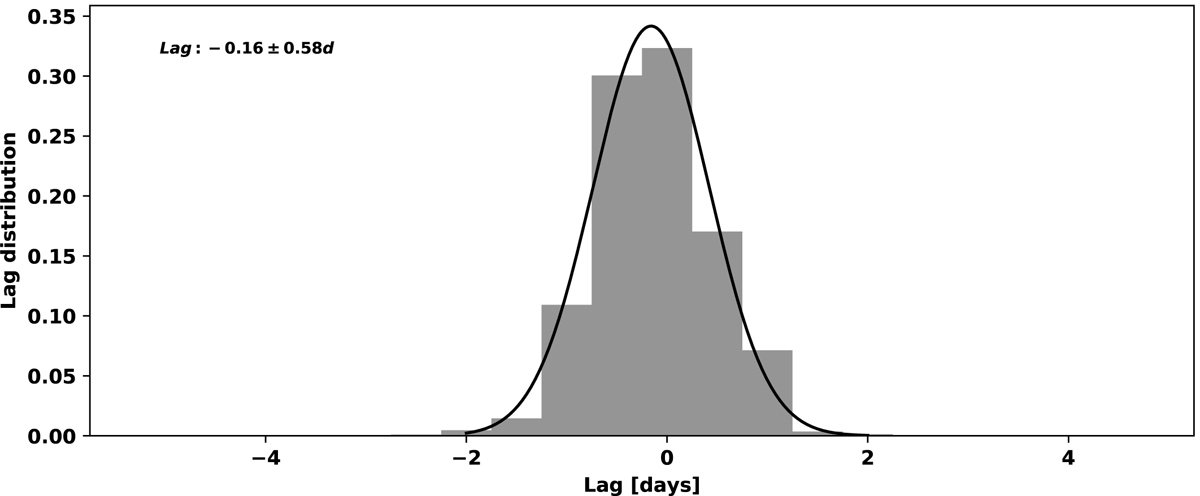
Combined lag distribution between TeV and X-rays (all bands) derived from FR/RSS DCF simulations (more details are provided in Sect. 3.2). A Gaussian fit (black line) was applied to derive mean and uncertainty values.
Current usage metrics show cumulative count of Article Views (full-text article views including HTML views, PDF and ePub downloads, according to the available data) and Abstracts Views on Vision4Press platform.
Data correspond to usage on the plateform after 2015. The current usage metrics is available 48-96 hours after online publication and is updated daily on week days.
Initial download of the metrics may take a while.