Fig. 4.
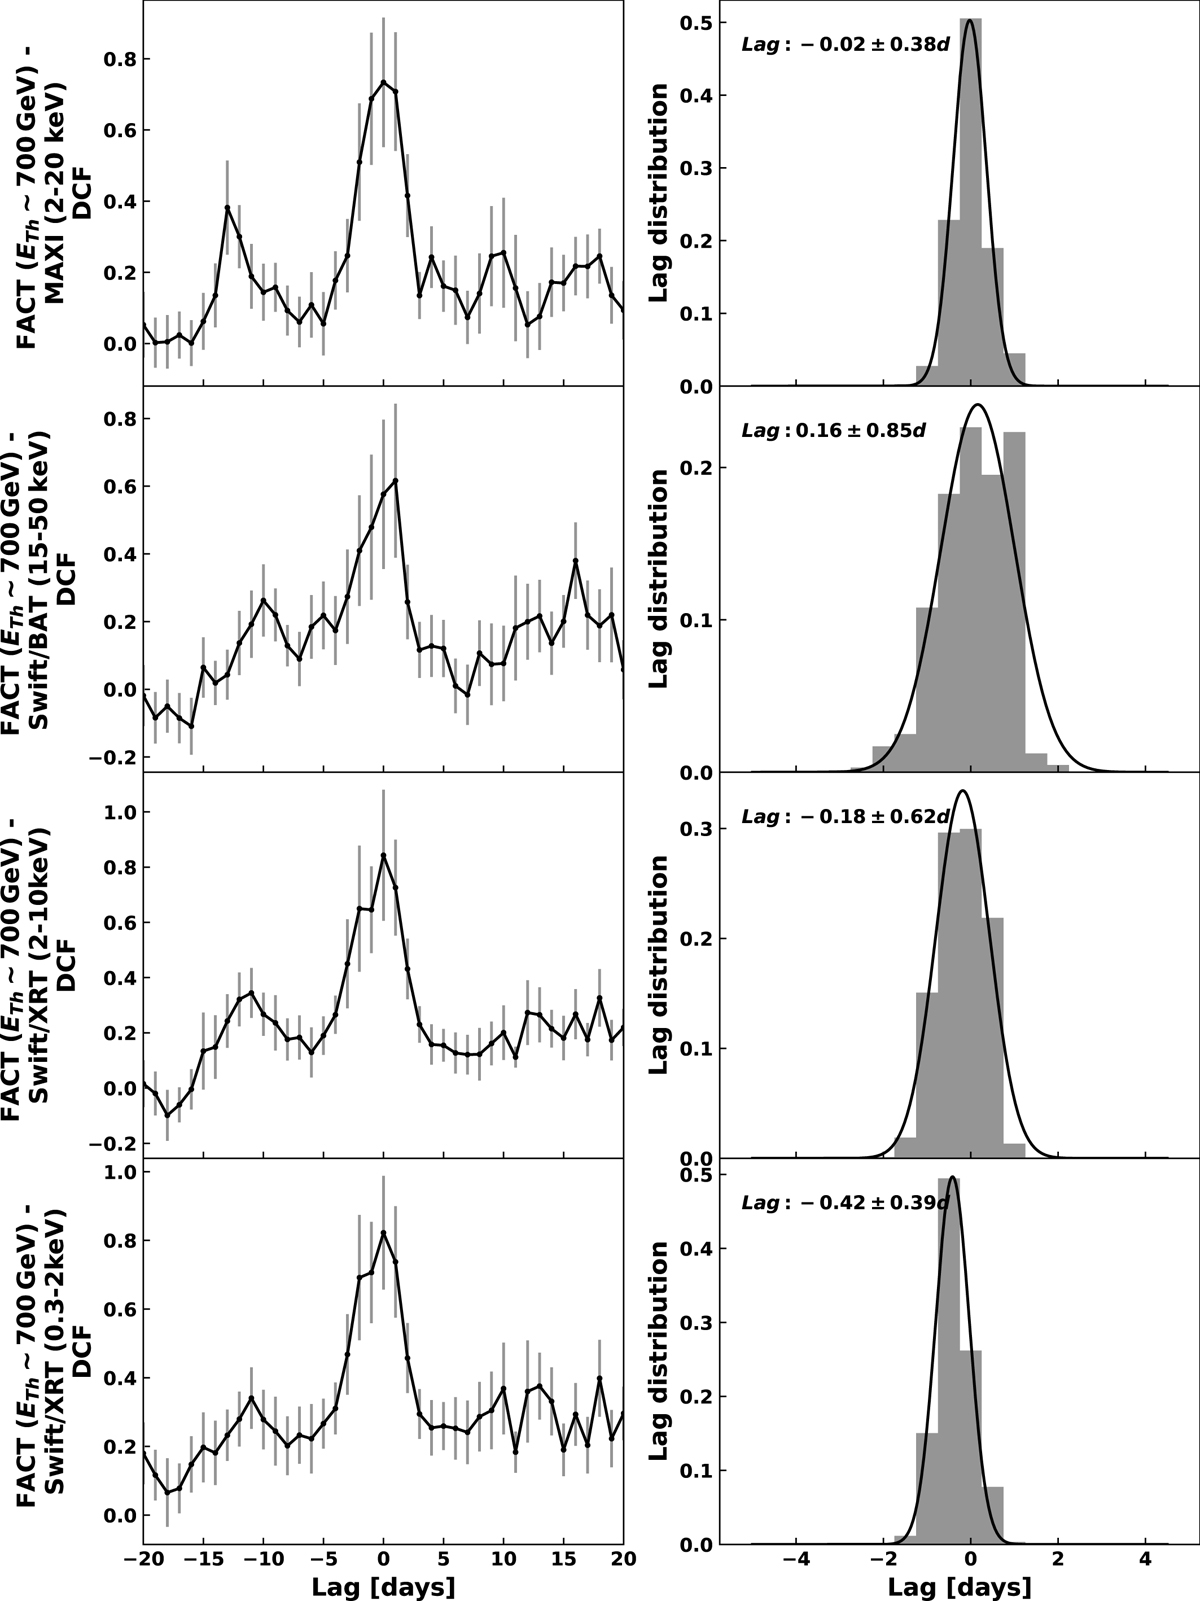
DCF cross-correlations of light curves (from top to bottom panel): FACT with Swift/BAT, MAXI, Swift/XRT (2–10 keV), Swift/XRT (0.3–2 keV). One-day binning was used. Left: DCF values as a function of lag. Grey error bars denote 1σ uncertainties. Right: lag distributions derived from FR/RSS simulations (more details are provided in Sect. 3.2). A Gaussian fit (black lines) was used to derive the lag indicated on the plots.
Current usage metrics show cumulative count of Article Views (full-text article views including HTML views, PDF and ePub downloads, according to the available data) and Abstracts Views on Vision4Press platform.
Data correspond to usage on the plateform after 2015. The current usage metrics is available 48-96 hours after online publication and is updated daily on week days.
Initial download of the metrics may take a while.