Fig. 2.
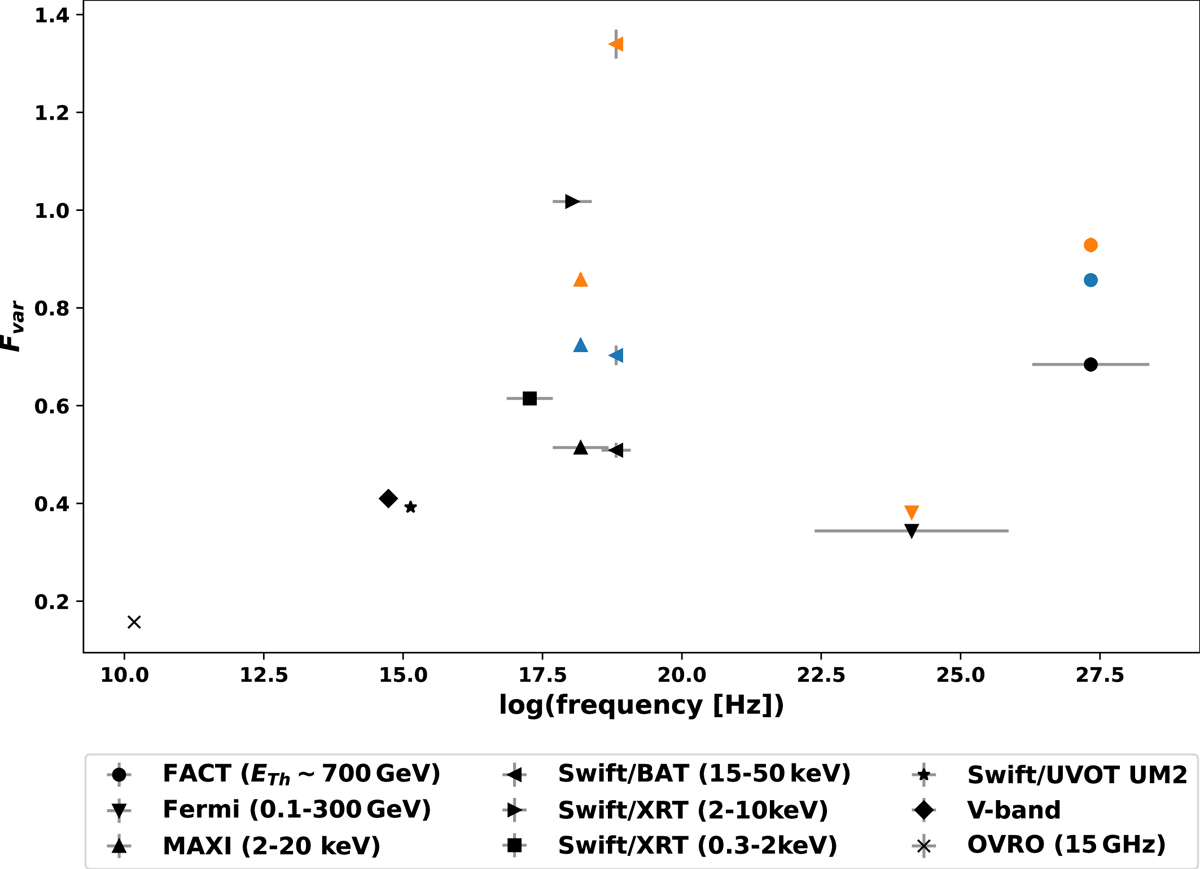
Fractional variability Fvar as a function of frequency. X-axis error bars indicate the energy band of the instrument. Y-axis error bars denote uncertainty on the Fvar value, and are smaller than the marker for most instruments. For FACT, Fermi-LAT, Swift/BAT, and MAXI, several markers are shown for different data-selection approaches: keeping all (orange), only > 2σ (black), or only positive (blue) data.
Current usage metrics show cumulative count of Article Views (full-text article views including HTML views, PDF and ePub downloads, according to the available data) and Abstracts Views on Vision4Press platform.
Data correspond to usage on the plateform after 2015. The current usage metrics is available 48-96 hours after online publication and is updated daily on week days.
Initial download of the metrics may take a while.