Fig. 1.
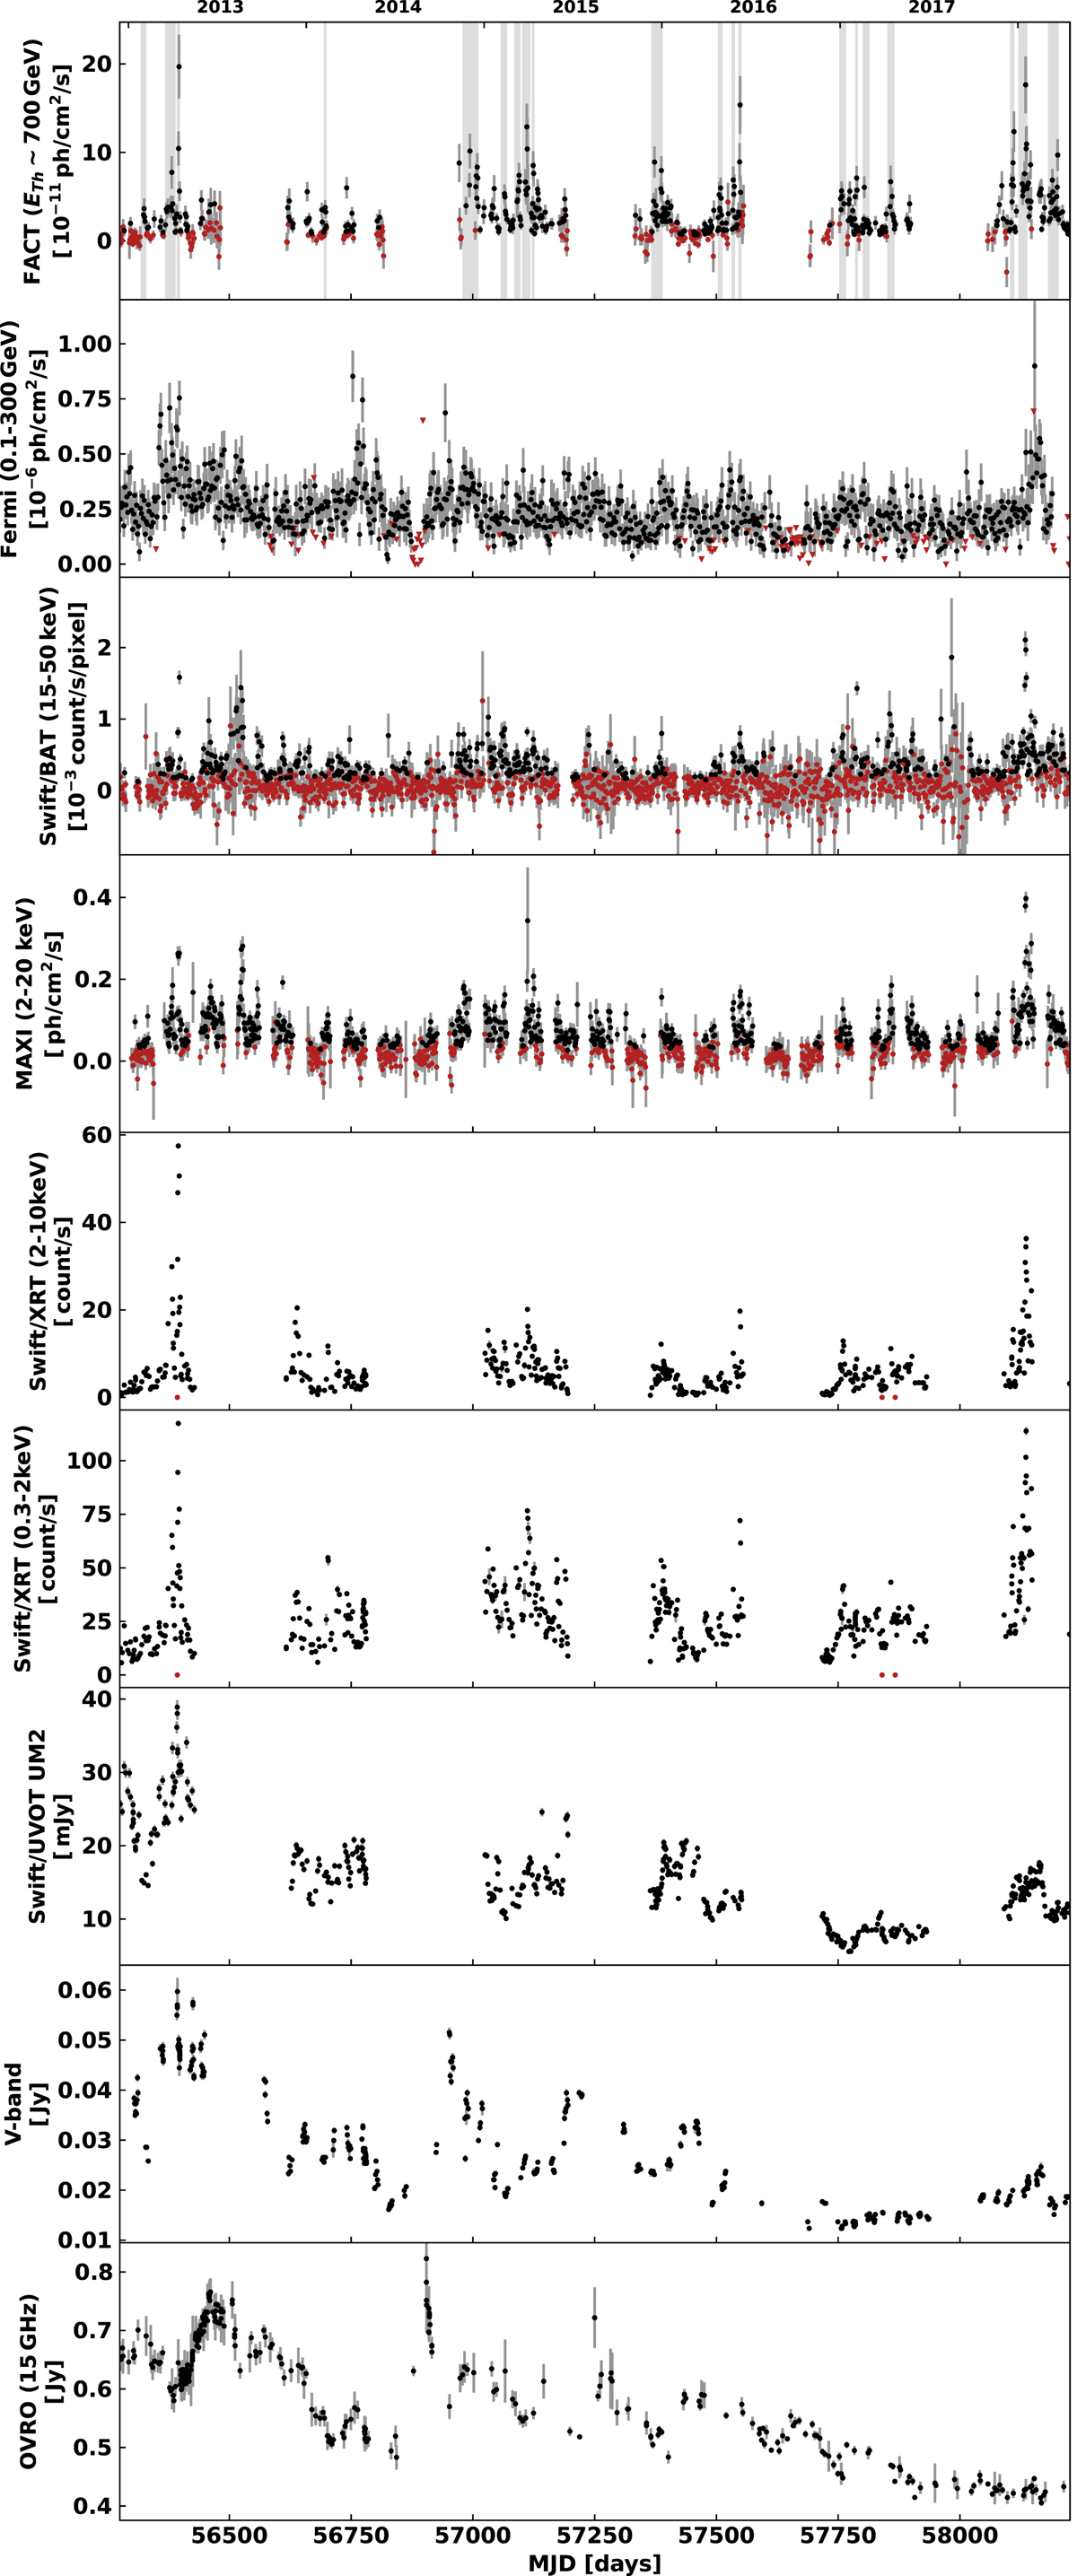
Long-term light curves of Mrk 421 obtained from the radio to the TeV between December 14, 2012, and April 18, 2018. From top to bottom: FACT (ETh ∼ 700 GeV), Fermi-LAT (0.1–300 GeV), MAXI (2–20 keV), Swift/BAT (15–50 keV), Swift/XRT (2–10 keV), Swift/XRT (0.3–2 keV), Swift/UVOT UVM2, V-band optical observations, and radio observations at 15 GHz. Flux measurement errors are denoted as vertical grey bars. Points with signal-to-noise ratio lower than two are coloured red (see Sect. 2 for details on the cleaning procedures). For the FACT light curve, there are 177 (out of 580) such points. For the Fermi-LAT light curve, 95% flux upper limits (TS < 25) are shown with triangles. For the FACT light curve, the flares listed in Table 1 are highlighted in grey.
Current usage metrics show cumulative count of Article Views (full-text article views including HTML views, PDF and ePub downloads, according to the available data) and Abstracts Views on Vision4Press platform.
Data correspond to usage on the plateform after 2015. The current usage metrics is available 48-96 hours after online publication and is updated daily on week days.
Initial download of the metrics may take a while.