Fig. 2.
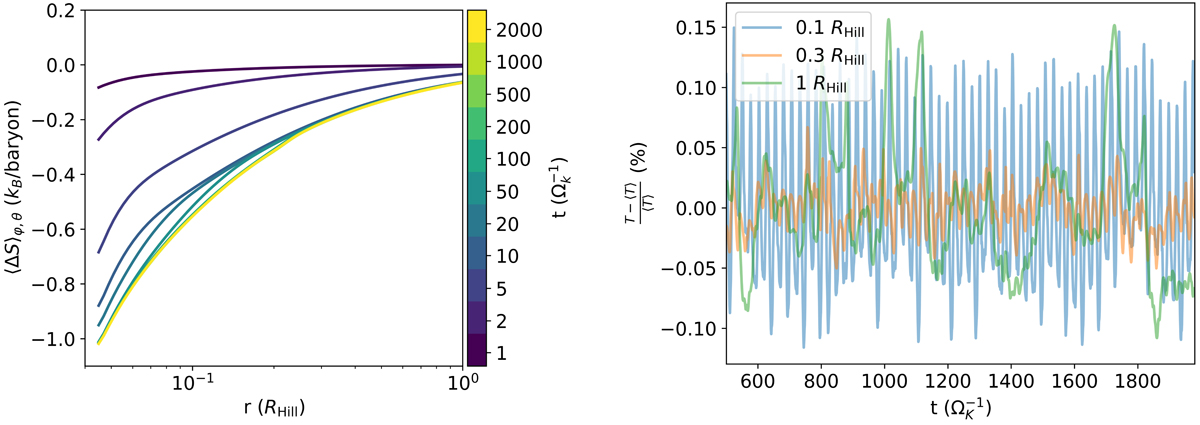
Thermal evolution of the three-dimensional simulation. Left: time evolution of the spherically averaged entropy. The lines are spaced logarithmically in time and the last four lines overlap, indicating the emergence of a radial entropy profile that is constant in time. Right: relative temperature deviation to the mean temperature in the steady state at three distances to the protoplanetary core. The trend line slopes of (− 0.84 ± 4.21) × 10−6% ΩK at 0.1 RHill, (− 4.21 ± 1.12) × 10−6% ΩK at 0.3 RHill, and (− 2.28 ± 0.31) × 10−5% ΩK at 1 RHill are consistent with a true steady state.
Current usage metrics show cumulative count of Article Views (full-text article views including HTML views, PDF and ePub downloads, according to the available data) and Abstracts Views on Vision4Press platform.
Data correspond to usage on the plateform after 2015. The current usage metrics is available 48-96 hours after online publication and is updated daily on week days.
Initial download of the metrics may take a while.