Fig. 3.
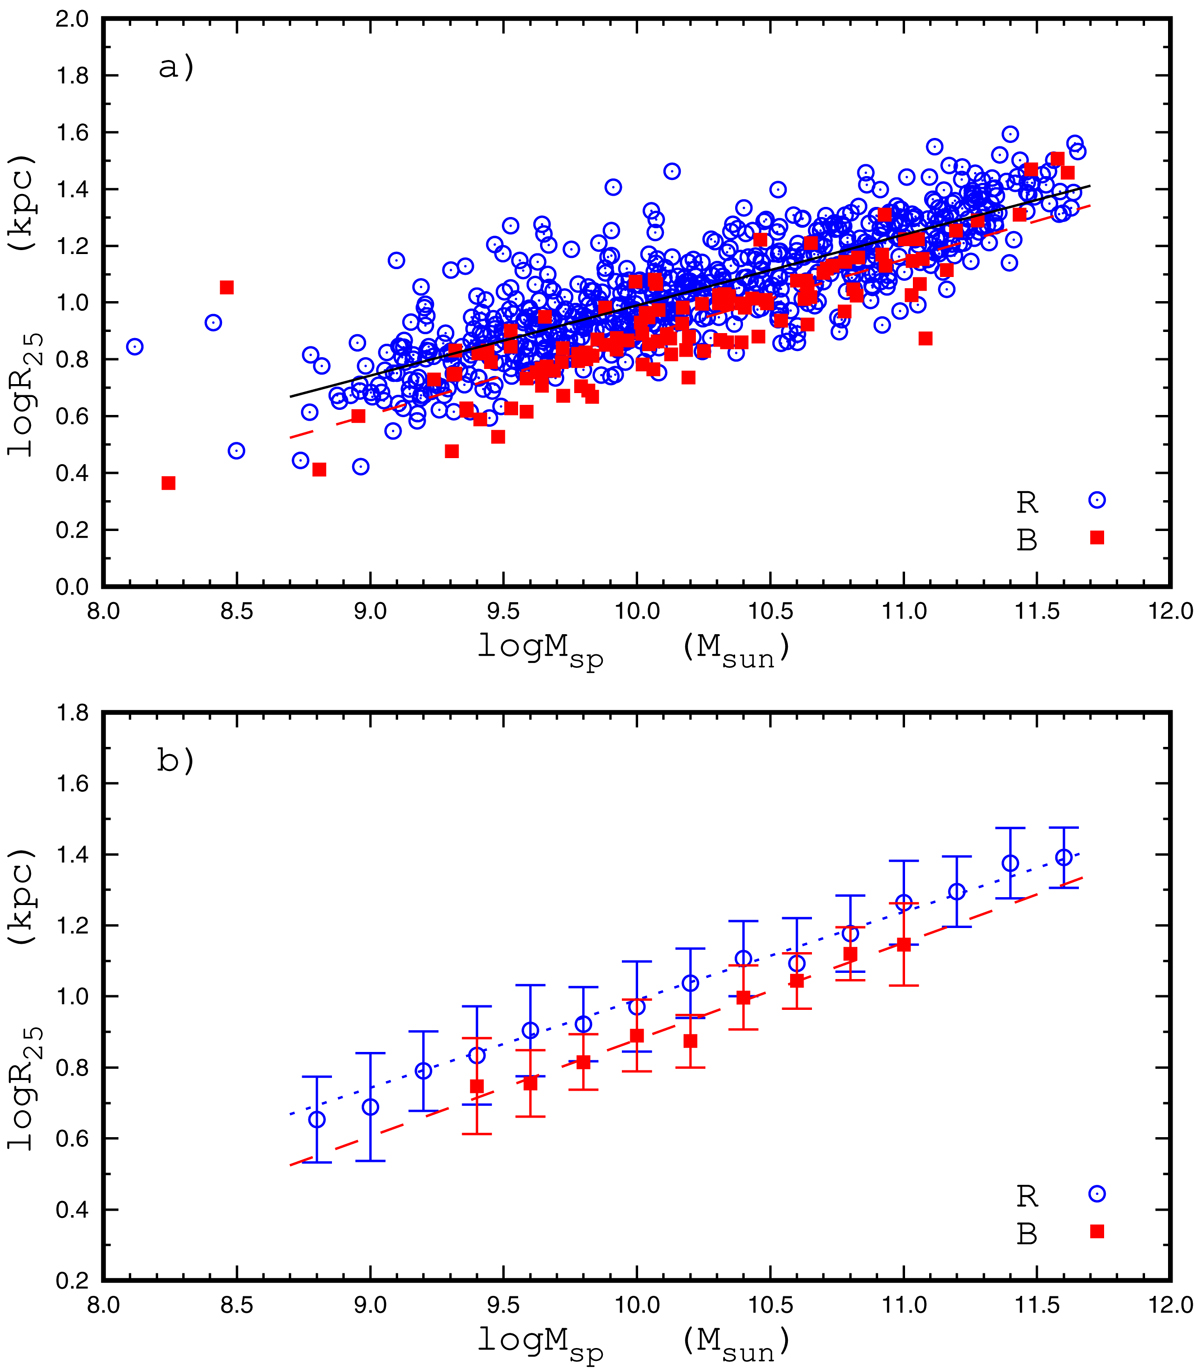
Relation between optical radius R25 and stellar mass Msp. Panel a: R25 as a function of Msp for individual galaxies with R distribution (blue circles) and B distribution (red squares) of the gas velocity dispersion. Panel b: median values of R25 for galaxies in bins of 0.3 dex in Msp for galaxies with R distribution, shown with blue circles. The solid line is the linear best fit to those data. Red squares denote the binned median values for galaxies with B distribution. The dashed line is the linear best fit to those data.
Current usage metrics show cumulative count of Article Views (full-text article views including HTML views, PDF and ePub downloads, according to the available data) and Abstracts Views on Vision4Press platform.
Data correspond to usage on the plateform after 2015. The current usage metrics is available 48-96 hours after online publication and is updated daily on week days.
Initial download of the metrics may take a while.