Fig. 2.
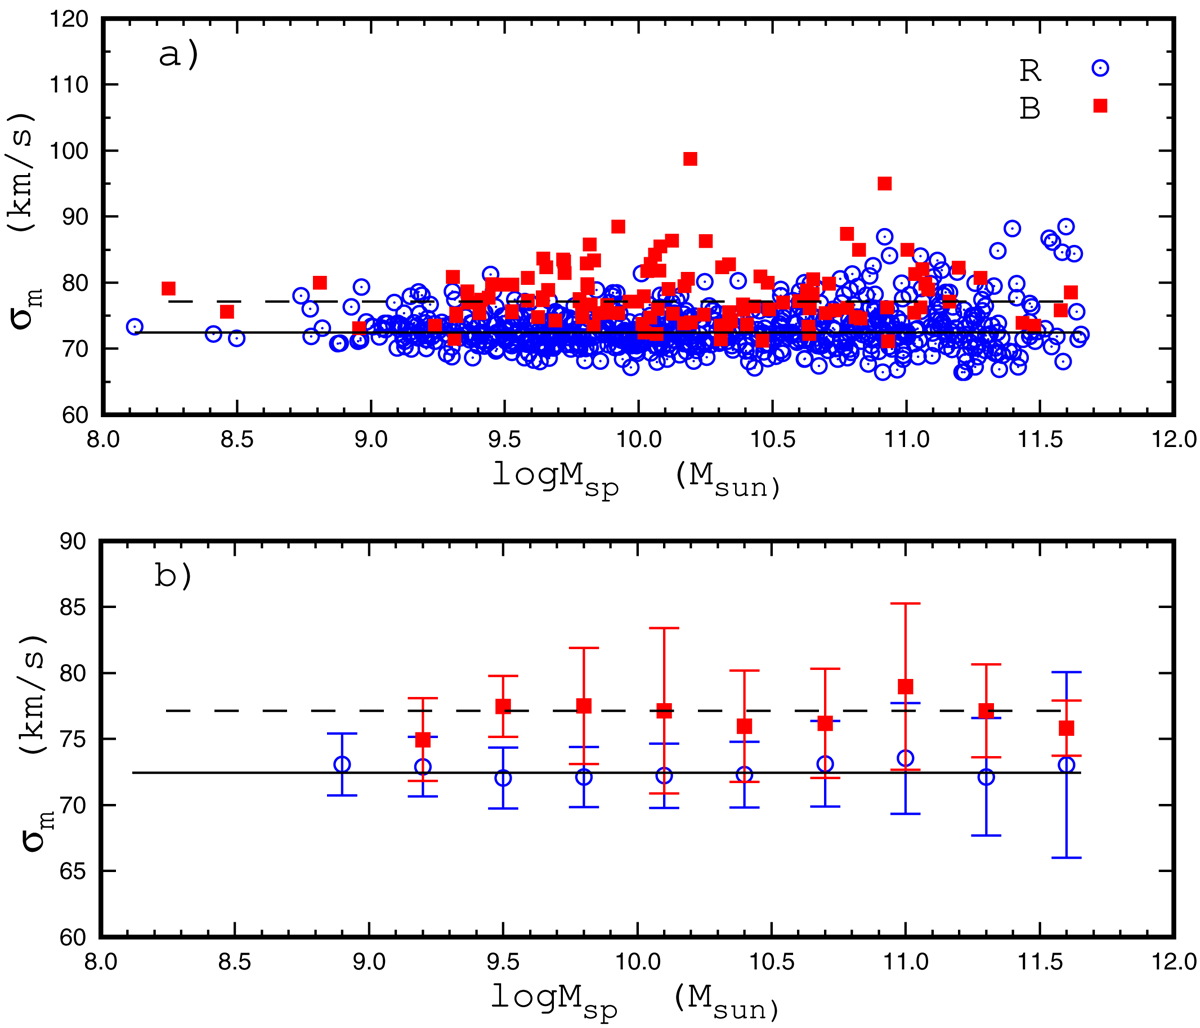
Median values of gas velocity dispersion σm in galaxies with R and B distributions. Panel a: σm as a function of the spectroscopic stellar mass Msp for individual galaxies with R distribution (blue circles) and with B distribution (red squares). The solid line shows the median value of σm in galaxies with R distribution, and the dashed line shows the median value of σm for galaxies with B distribution. Panel b: median values of σm for galaxies in bins of 0.3 dex in Msp for R-distribution galaxies (blue circles) and B-distribution galaxies (red squares). The lines come from panel a.
Current usage metrics show cumulative count of Article Views (full-text article views including HTML views, PDF and ePub downloads, according to the available data) and Abstracts Views on Vision4Press platform.
Data correspond to usage on the plateform after 2015. The current usage metrics is available 48-96 hours after online publication and is updated daily on week days.
Initial download of the metrics may take a while.