Fig. 1.
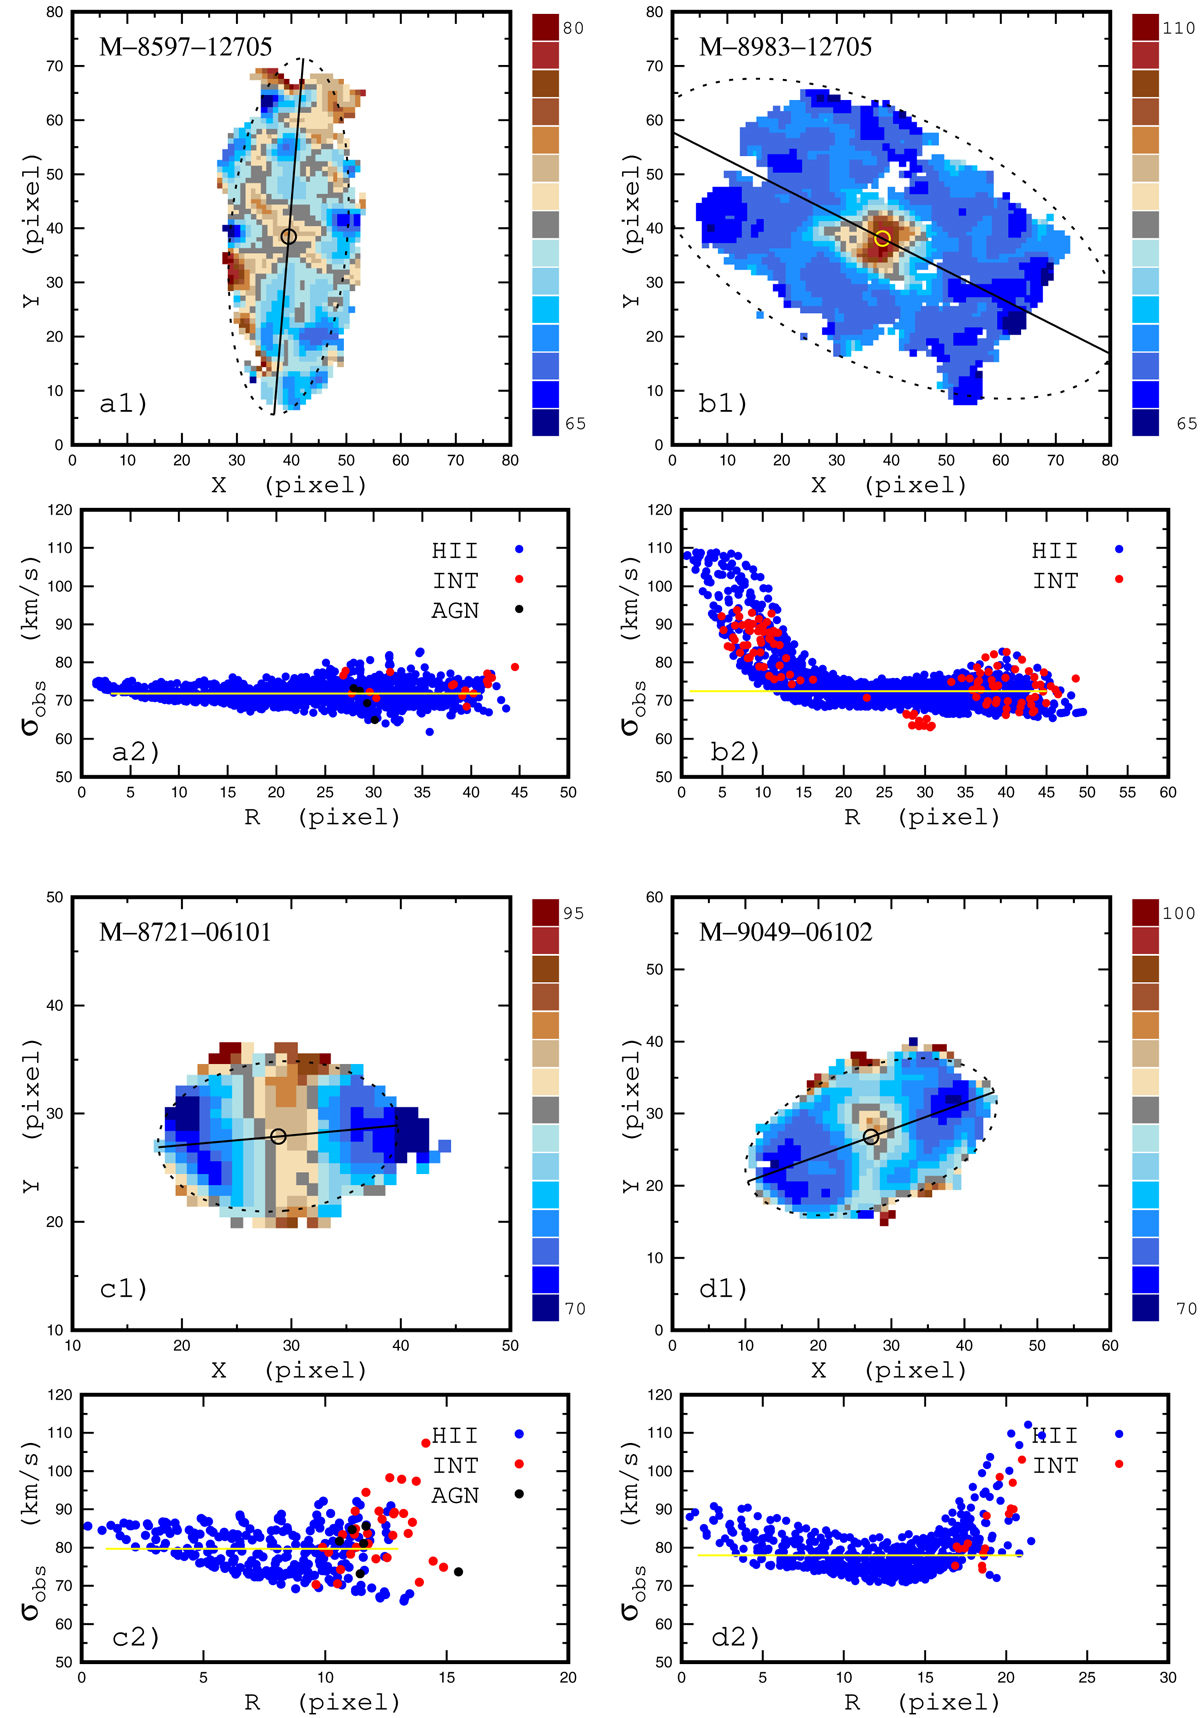
Examples of distributions of the gas velocity dispersion σ over images of galaxies. Panel a1: galaxy with R distribution of σ without an appreciable enhancement at the center. The values of the gas velocity dispersion are color-coded. The circle shows the photometric center of the galaxy, the solid line indicates the position of the major photometric axis of the galaxy, and the dashed line marks the optical radius of the galaxy, R25. Panel a2: observed gas velocity dispersion as a function of radius for individual spaxels. The BPT type of the spectra is color-coded. The line indicates the median value of the gas velocity dispersions. Panel b1: galaxy with R distribution and with a significant enhancement of the σ at the center. Panel b2: radial distribution of the σ in this galaxy. Panels c1 and d1: examples of galaxies with B distribution. Panels c2 and d2: gas velocity dispersion as a function of radius for those galaxies.
Current usage metrics show cumulative count of Article Views (full-text article views including HTML views, PDF and ePub downloads, according to the available data) and Abstracts Views on Vision4Press platform.
Data correspond to usage on the plateform after 2015. The current usage metrics is available 48-96 hours after online publication and is updated daily on week days.
Initial download of the metrics may take a while.