Fig. 3.
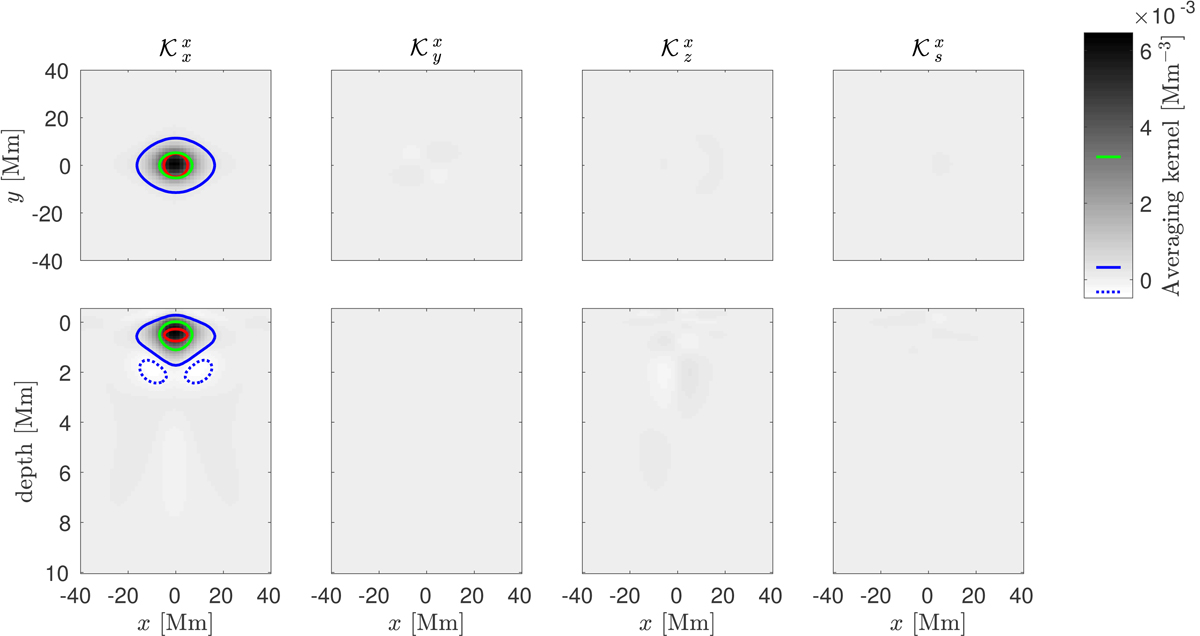
Averaging kernel for the inversion for the longitudinal flows at the target depth of 0.5 Mm. Top row: Horizontal cuts at the target depth. Bottom row: vertical cuts at y = 0. Columns from left to right: localisations of the longitudinal flows, latitudinal flows, vertical flows, and sound-speed perturbations. The red curve corresponds to the half-maximum of the target function at the target depth. The green full, the blue full, and the blue dotted curves correspond to the half-maximum, +5%, and −5% of the maximum of the averaging kernel at the target depth, respectively.
Current usage metrics show cumulative count of Article Views (full-text article views including HTML views, PDF and ePub downloads, according to the available data) and Abstracts Views on Vision4Press platform.
Data correspond to usage on the plateform after 2015. The current usage metrics is available 48-96 hours after online publication and is updated daily on week days.
Initial download of the metrics may take a while.