Free Access
Fig. 2.
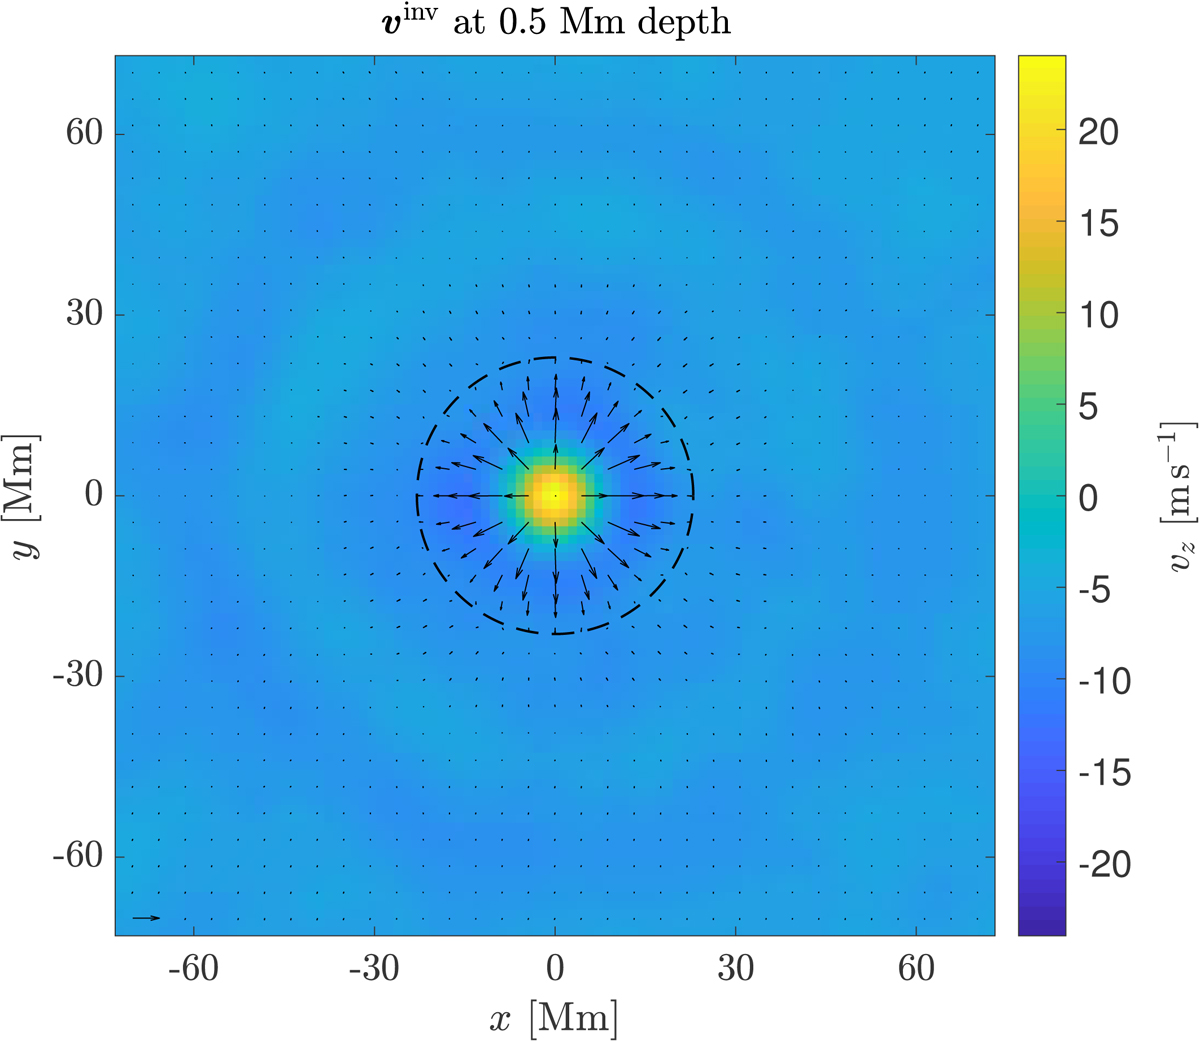
Inverted flows at 0.5 Mm depth. The colour map codes the vertical flows, where positive values correspond to upflows. The arrows correspond to the horizontal flows. The reference arrow in the bottom left-hand corner corresponds to 250 m s−1. The radius of the black dashed circle is approximately 23 Mm.
Current usage metrics show cumulative count of Article Views (full-text article views including HTML views, PDF and ePub downloads, according to the available data) and Abstracts Views on Vision4Press platform.
Data correspond to usage on the plateform after 2015. The current usage metrics is available 48-96 hours after online publication and is updated daily on week days.
Initial download of the metrics may take a while.