Fig. 9.
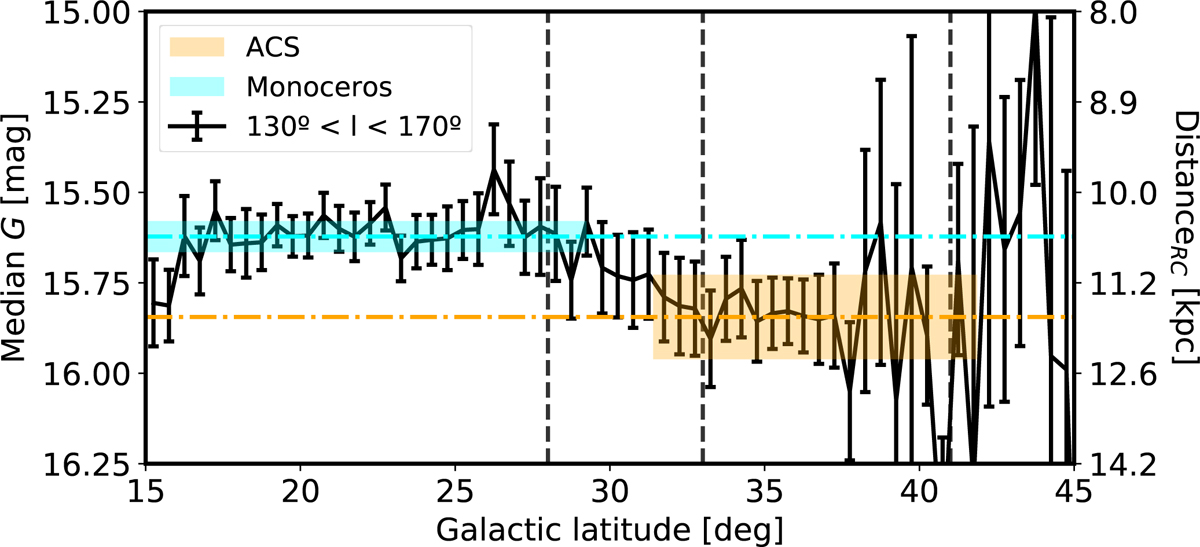
Apparent magnitude of giant peak stars in the anticentre region (130° < l < 170°) as a function of Galactic latitude. The magnitudes shown on the left y-axis have been corrected for extinction (see text). The error bars denote the 1σ uncertainty on the median computed as ![]() , where σ is the standard deviation of the apparent magnitude in the bin. Vertical lines represent the approximate limits of each structure in that range of Galactic longitudes (see Fig. 4), and the right axis represents the distance to an RC star, with the apparent magnitude shown in the left axis. The horizontal lines correspond to the median G magnitude for the giant peak stars within MNC (cyan) and the ACS (orange). The shaded areas contain the ±3σ interval of uncertainty on the median, and they extend from the minimum to the maximum latitude of the peak stars within each patch (the vertical dashed lines serve only as an orientation). As can be seen, the ACS is fainter than MNC, and this translates into a difference in distance of ∼1 kpc.
, where σ is the standard deviation of the apparent magnitude in the bin. Vertical lines represent the approximate limits of each structure in that range of Galactic longitudes (see Fig. 4), and the right axis represents the distance to an RC star, with the apparent magnitude shown in the left axis. The horizontal lines correspond to the median G magnitude for the giant peak stars within MNC (cyan) and the ACS (orange). The shaded areas contain the ±3σ interval of uncertainty on the median, and they extend from the minimum to the maximum latitude of the peak stars within each patch (the vertical dashed lines serve only as an orientation). As can be seen, the ACS is fainter than MNC, and this translates into a difference in distance of ∼1 kpc.
Current usage metrics show cumulative count of Article Views (full-text article views including HTML views, PDF and ePub downloads, according to the available data) and Abstracts Views on Vision4Press platform.
Data correspond to usage on the plateform after 2015. The current usage metrics is available 48-96 hours after online publication and is updated daily on week days.
Initial download of the metrics may take a while.