Fig. 8.
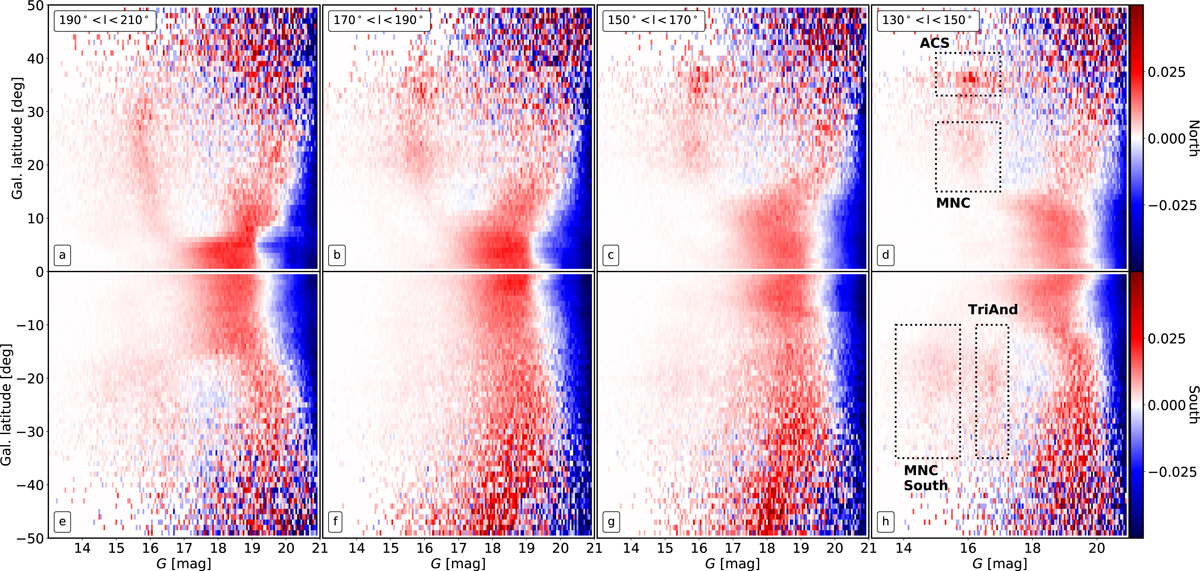
Differences between the data and the mock in the plane of apparent magnitude against Galactic latitude. Panels a and h are obtained by subtracting the counts (normalised by latitude) from the top and bottoms panels of Fig. 7. The same is done for the rest of panels but at different ranges of longitude. From right to left: 130° < l < 150°, 150° < l < 170°, 170° < l < 190°, and 190° < l < 210°. Panels d and h: we highlight the regions of interest. The boxes around the ACS and MNC are based on the latitude ranges defined in Fig. 4.
Current usage metrics show cumulative count of Article Views (full-text article views including HTML views, PDF and ePub downloads, according to the available data) and Abstracts Views on Vision4Press platform.
Data correspond to usage on the plateform after 2015. The current usage metrics is available 48-96 hours after online publication and is updated daily on week days.
Initial download of the metrics may take a while.